Azure Monitor
An Azure service that is used to collect, analyze, and act on telemetry data from Azure and on-premises environments.
2,829 questions
This browser is no longer supported.
Upgrade to Microsoft Edge to take advantage of the latest features, security updates, and technical support.
' cx='32' cy='32' r='32' /%3E%3Ctext x='50%25' y='55%25' dominant-baseline='middle' text-anchor='middle' fill='%23FFF' %3EAK%3C/text%3E%3C/svg%3E)
Hello,
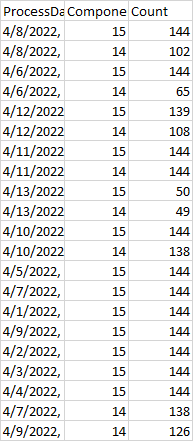
I am trying to create a chart for our monitoring dashboard. The values are as per screenshot1, when i render to column chart i am seeing as per screenshot2.
I basically need something grouping 14&15 together for a particular day.
I am using the following kql
finaldata
| render columnchart
Can someone help me in grouping the componentid per day.

Hi,
It is unclear what the exact problem is. Also, it is very difficult to provide any answer to queries without having the structure of the data or example data.
shooting in blank but may be this is something you want to achieve:
finaldata | render columnchart kind =unstacked
Please "Accept the answer" if the information helped you. This will help us and others in the community as well.
Stan,
Thanks for your answer.
The problem is if you see in the chart attached, the data for 14 is stacked up on 15. However i want the data to be next to see other in the chart for that particular day. Hope this clarifies your question. Here is the sample data attached in csv.
See updated original answer if that will help you resolve the issue. Query is updated.