Windows Performance Analyzer doesn't show CPU usage sampled data in my profiles

Tony Grey 21 Reputation points
2022-04-14T07:04:17.703+00:00

Hello! It started a few months ago, but I don't have any sampled CPU usage data when I view my ETW profiles in Windows Performance Analyzer. It looks like this:
192926-image.png
Notice that the preset is configured in a way to show the sample CPU usage (because I used to have it), but now it shows nothing.
Also, in the left panel, you can see that the Computation menu doesn't contain CPU usage (Sampled) as an option.
I tried everything (purged the perf tools), but can't make it collect the sampled data. I also tried to enable this CPU usage flag in the perf recorder, but didn't have luck either:
192927-image.png
The weirdest thing is that I'm able to get the sampled data on another machine, with the same exact options.
How can I fix this?

Windows Performance Toolkit
A collection of Microsoft performance monitoring tools that produce in-depth performance profiles of Windows operating systems and applications.
80 questions
{count} votes

Accepted answer
  1. Gary Nebbett 5,721 Reputation points
    2022-05-05T08:43:17.457+00:00

    Hello Tony,

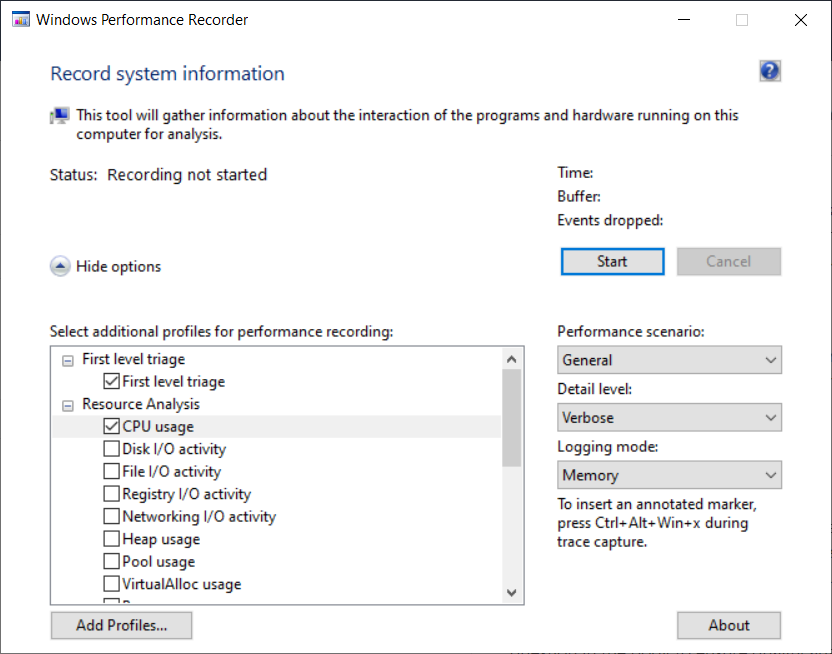
    The command wpr -profiles lists the predefined profiles (the same as the list in the WPR UI) and wpr -profiledetails CPU (for example) gives an overview of what is collected by the profile. wpr -exportprofile CPU cpu.wprp exports the profile, which can then be edited.

    For sample profiling, the minimum set of keywords for use with WPA is Loader, ProcessThread and SampledProfile; the minimum set of stacks is SampledProfile.

    None of the EventProvider items are needed (although some might be useful if focusing on .NET or JScript code).

    Starting from cpu.wprp and removing what I think is not essential gives:

    <WindowsPerformanceRecorder Version="1.0">
      <Profiles>
        <SystemCollector Id="WPR_initiated_WprApp_WPR_System_Collector" Name="WPR_initiated_WprApp_WPR System Collector">
          <BufferSize Value="1024" />
          <Buffers Value="813" />
        </SystemCollector>
        <SystemProvider Id="WPR_initiated_WprApp_WPR_System_Collector_Provider">
          <Keywords>
            <Keyword Value="Loader" />
            <Keyword Value="ProcessThread" />
            <Keyword Value="SampledProfile" />
          </Keywords>
          <Stacks>
            <Stack Value="SampledProfile" />
          </Stacks>
        </SystemProvider>
        <Profile Id="CPU.Verbose.Memory" Name="CPU" Description="RunningProfile:CPU.Verbose.Memory" LoggingMode="Memory" DetailLevel="Verbose">
          <Collectors>
            <SystemCollectorId Value="WPR_initiated_WprApp_WPR_System_Collector">
              <SystemProviderId Value="WPR_initiated_WprApp_WPR_System_Collector_Provider" />
            </SystemCollectorId>
          </Collectors>
        </Profile>
      </Profiles>
    </WindowsPerformanceRecorder>
    

    If something useful seems to be missing when analysing with WPA, then just add back items that seem possibly relevant and then collect new data.

    Let us know about the reliability of capturing profiling data - I am still intrigued by what you are observing.

    Gary


2 additional answers

Sort by: Most helpful
  1. Tony Grey 21 Reputation points
    2022-05-02T08:23:37.45+00:00

    Tried to update to Windows 11, but the issue still persists. Even though sometimes I can get the CPU sampled data, I can't specify any pattern of whether it's shown or not. Of course, I also tried to purge Windows ADK - no luck.
    Can somebody give me a clue on how to fix it?


  2. Gary Nebbett 5,721 Reputation points
    2022-05-02T20:22:54.067+00:00

    Hello Tony,

    If you are prepared to share data, you could try the following. Save the XML below as a file, named (for example) test.wprp.

    <?xml version="1.0" encoding="utf-8"?>
    <!-- wpr -start test.wprp!PMC -filemode -->
    <!-- wpr -stop ?.etl -->
    <WindowsPerformanceRecorder Version="1.0" Author="Gary">
      <Profiles>
        <SystemCollector Id="NTKL" Name="NT Kernel Logger">
          <BufferSize Value="64" />
          <Buffers Value="128" />
        </SystemCollector>
        <EventCollector Id="ETW" Name="ETW">
          <BufferSize Value="64" />
          <Buffers Value="128" />
        </EventCollector>
        <SystemProvider Id="WMI">
          <Keywords>
            <Keyword Value="PmcProfile" />
            <Keyword Value="SampledProfile" />
          </Keywords>
        </SystemProvider>
        <HardwareCounter Id="PMC">
          <SampledCounters>
            <SampledCounter Value="Timer" Interval="600000" />
            <SampledCounter Value="TotalIssues" Interval="100000000" />
          </SampledCounters>
        </HardwareCounter>
        <Profile Id="PMC.Verbose.File" Name="PMC" Description="PMC" DetailLevel="Verbose" LoggingMode="File">
          <Collectors>
            <SystemCollectorId Value="NTKL">
              <SystemProviderId Value="WMI" />
              <HardwareCounterId Value="PMC" />
            </SystemCollectorId>
          </Collectors>
        </Profile>
      </Profiles>
    </WindowsPerformanceRecorder>
    

    Then issue the commands wpr -start test.wprp!PMC -filemode and (a second or two later) wpr -stop why.etl. On my PC, when compressed with ZIP, the resulting trace data in why.etl was about 40 kilobytes.

    If you can make why.etl available to me, I will see what can be inferred about the state of sampled profiling on your system.

    Gary