Developer technologies | ASP.NET | Other
A set of technologies in .NET for building web applications and web services. Miscellaneous topics that do not fit into specific categories.
This browser is no longer supported.
Upgrade to Microsoft Edge to take advantage of the latest features, security updates, and technical support.
' cx='32' cy='32' r='32' /%3E%3Ctext x='50%25' y='55%25' dominant-baseline='middle' text-anchor='middle' fill='%23FFF' %3EDH%3C/text%3E%3C/svg%3E)
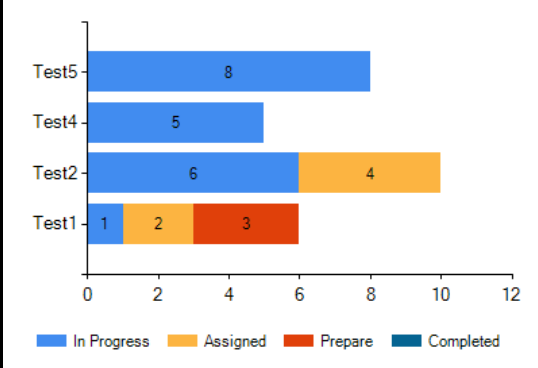
I have created a stacked chart as below. But it's Y axis label values are not coming correctly.
'Test3' from the data table is missing on the axis label. And it's values are coming with 'test 1'. Please help to correct.
<asp:Chart ID="Chart1" runat="server" Height="300px" Width="400px">
<Titles>
<asp:Title ShadowOffset="0" Name="Items" Text="TEST STATUS" />
</Titles>
<Series>
<asp:Series Name="In Progress" IsValueShownAsLabel="true" ChartType="StackedBar" ></asp:Series>
<asp:Series Name="Assigned" IsValueShownAsLabel="true" ChartType="StackedBar"></asp:Series>
<asp:Series Name="Prepare" IsValueShownAsLabel="true" ChartType="StackedBar"></asp:Series>
<asp:Series Name="Completed" IsValueShownAsLabel="true" ChartType="StackedBar"></asp:Series>
</Series>
<Legends>
<asp:Legend Alignment="Center" Docking="Bottom" IsTextAutoFit="False" Name="Default"
LegendStyle="Row" />
</Legends>
<ChartAreas>
<asp:ChartArea Name="ChartArea1" BorderWidth="0" >
<axisy>
<MajorGrid Enabled ="False" />
</axisy>
<axisx>
<MajorGrid Enabled="false"/>
</axisx>
</asp:ChartArea>
</ChartAreas>
</asp:Chart>
data_tasks = new DataTable();
data_tasks.Columns.AddRange(new DataColumn[3] { new DataColumn("total", typeof(int)),
new DataColumn("task_status_name", typeof(string)),
new DataColumn("type_of_task",typeof(string)) });
data_tasks.Rows.Add(1, "In Progress", "Test1");
data_tasks.Rows.Add(2, "Assigned", "Test2");
data_tasks.Rows.Add(3, "Prepare", "Test3");
data_tasks.Rows.Add(4, "Assigned", "Test2");
data_tasks.Rows.Add(5, "In Progress", "Test4");
data_tasks.Rows.Add(6, "In Progress", "Test2");
data_tasks.Rows.Add(8, "In Progress", "Test5");
//Get the DISTINCT task_statuses.
List<string> task_status_list = (from p in data_tasks.AsEnumerable()
select p.Field<string>("task_status_name")).Distinct().ToList();
            //Loop through the task_statuses.
            foreach (string task_Status in task_status_list)
            {
                //Get the type_of_task for each task_status.
                string[] x = (from p in data_tasks.AsEnumerable()
                           where p.Field<string>("task_status_name") == task_Status
                              orderby p.Field<string>("type_of_task") ascending
                           select p.Field<string>("type_of_task")).ToArray();

                //Get the Total of tasks for each taskstatus.
                int[] y = (from p in data_tasks.AsEnumerable()
                           where p.Field<string>("task_status_name") == task_Status
                             orderby p.Field<string>("type_of_task") ascending
                           select p.Field<int>("total")).ToArray();

                Chart1.Series[task_Status].Points.DataBindXY(x, y);
            }

        }
' cx='32' cy='32' r='32' /%3E%3Ctext x='50%25' y='55%25' dominant-baseline='middle' text-anchor='middle' fill='%23FFF' %3ELH%3C/text%3E%3C/svg%3E)
Hi @Divya Hari ,
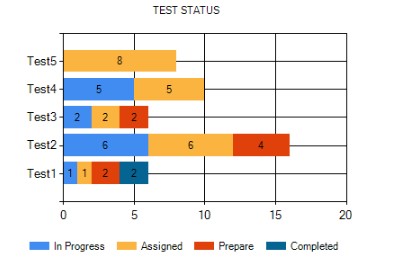
I tried your code and found the problem.
You are locating coordinates based on task_status so you need to make sure task_status_name is included in each entry.
'Test3' from the data table is missing on the axis label.
"Test3" is missing because "Test3" has no In Progress.
it's values are coming with 'test 1'.
The data that needs to be displayed is included in the next line, such as data_tasks.Rows.Add(4, "Assigned", "Test2"); Only when Test1 contains Assigned will it be displayed correctly, otherwise it will be displayed in text1.
                data_tasks.Rows.Add(1, "In Progress", "Test1");
                data_tasks.Rows.Add(1, "Assigned", "Test1");
                data_tasks.Rows.Add(2, "Prepare", "Test1");
                data_tasks.Rows.Add(2, "Completed", "Test4");


                data_tasks.Rows.Add(6, "In Progress", "Test2");
                data_tasks.Rows.Add(6, "Assigned", "Test2");
                data_tasks.Rows.Add(4, "Prepare", "Test2");


                data_tasks.Rows.Add(2, "In Progress", "Test3");
                data_tasks.Rows.Add(2, "Assigned", "Test3");
                data_tasks.Rows.Add(2, "Prepare", "Test3");

                data_tasks.Rows.Add(5, "In Progress", "Test4");
                data_tasks.Rows.Add(5, "Assigned", "Test4");

                data_tasks.Rows.Add(8, "Assigned", "Test5");
Best regards,
Lan Huang
If the answer is the right solution, please click "Accept Answer" and kindly upvote it. If you have extra questions about this answer, please click "Comment".
Note: Please follow the steps in our documentation to enable e-mail notifications if you want to receive the related email notification for this thread.