Azure SQL Database
An Azure relational database service.
6,326 questions
This browser is no longer supported.
Upgrade to Microsoft Edge to take advantage of the latest features, security updates, and technical support.
' cx='32' cy='32' r='32' /%3E%3Ctext x='50%25' y='55%25' dominant-baseline='middle' text-anchor='middle' fill='%23FFF' %3EC%3C/text%3E%3C/svg%3E)
Greetings.
On the azure portal, looking at the Overview and seeing that the DTU Percentage (max) has hit 100% a lot over the last 24 hours. However, when looking in Performance Overview or Query Performance Insights I cant find anything that comes anywhere near 100% for the Top 5 queries no matter how I sort, etc (CPU, IO, or Log). In fact if I total up all queries we're looking at maybe 5% for any of those columns.
I should also mention that I only have 1 DB on this guy.
So my questions are:

1) Azure SQL Database is always using 100% memory by design.
2) Where else to look at?
The following query tells you which resource(s) consumption is(are) creating DTU spike:
SELECT
    (COUNT(end_time) - SUM(CASE WHEN avg_cpu_percent > 80 THEN 1 ELSE 0 END) * 1.0) / COUNT(end_time) AS 'CPU Fit Percent'
    ,(COUNT(end_time) - SUM(CASE WHEN avg_log_write_percent > 80 THEN 1 ELSE 0 END) * 1.0) / COUNT(end_time) AS 'Log Write Fit Percent'
    ,(COUNT(end_time) - SUM(CASE WHEN avg_data_io_percent > 80 THEN 1 ELSE 0 END) * 1.0) / COUNT(end_time) AS 'Physical Data Read Fit Percent'
FROM sys.dm_db_resource_stats
If you change the aggregation types to max you may have a different perspective:
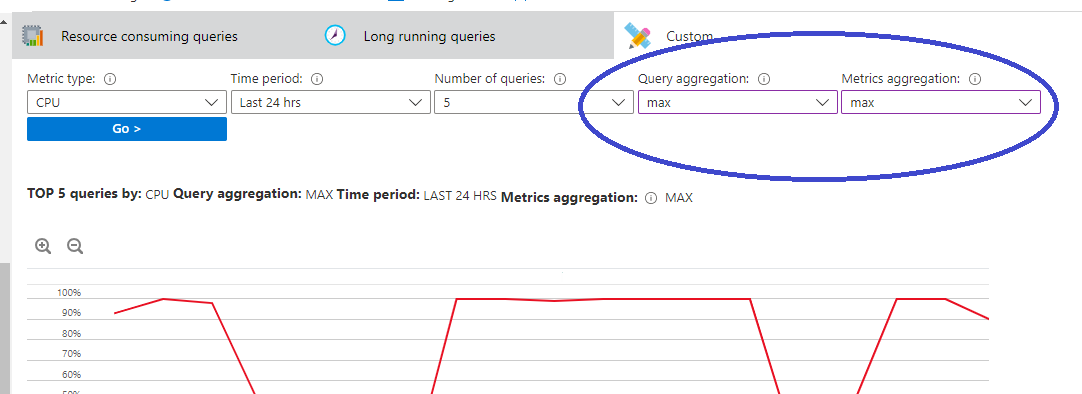
Changing those options QPI definitely helps as the graph now looks much closer to 100%, but the details down below is still in the 5-10% range.
Query the query store and change the ORDER BY of the queries depending on the component that is taking the DTU to 100%