Not Monitored
Tag not monitored by Microsoft.
35,982 questions
This browser is no longer supported.
Upgrade to Microsoft Edge to take advantage of the latest features, security updates, and technical support.
' cx='32' cy='32' r='32' /%3E%3Ctext x='50%25' y='55%25' dominant-baseline='middle' text-anchor='middle' fill='%23FFF' %3EPJ%3C/text%3E%3C/svg%3E)
Good afternoon,
I got into Power BI a week ago and I have been having some troubles with it.
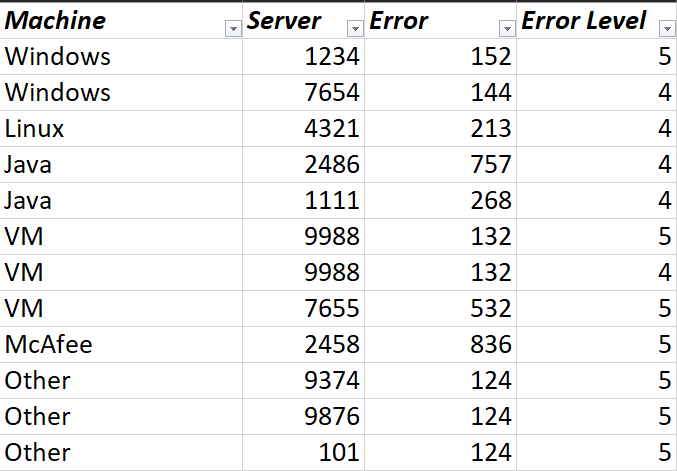
I got a simple Excel database composed by Operative Systems, Servers, Number of the Error and Error Level.
Every machine has errors and it can either be one of the levels (4 or 5) or it can has both errors.
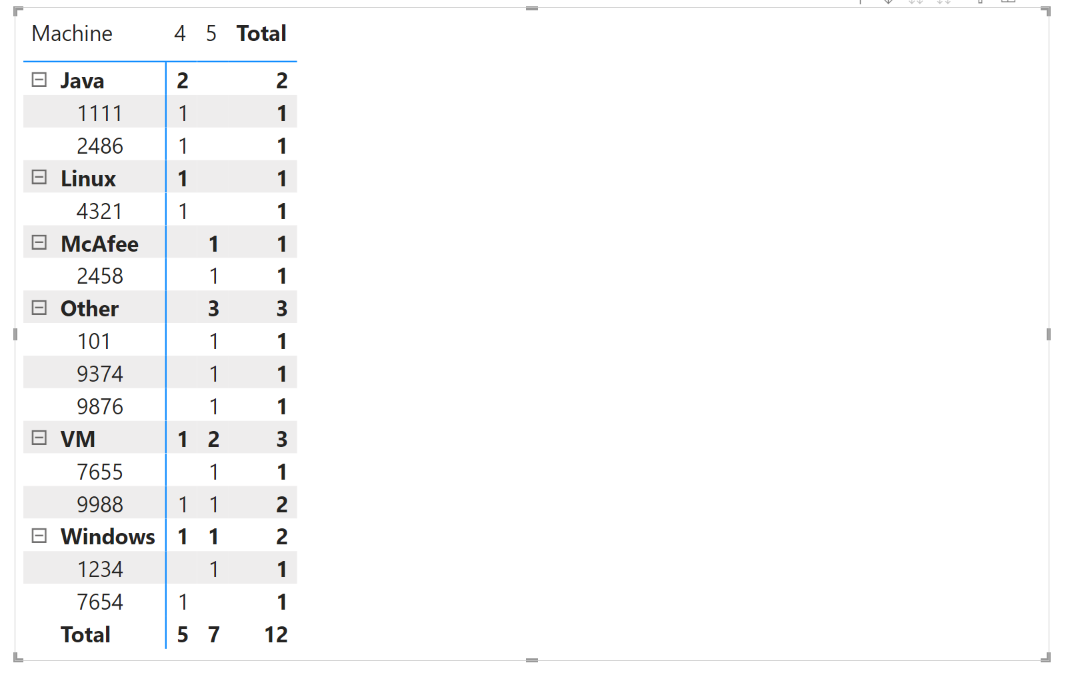
In my power BI matrix i got to have an option or something that whenever i select it will only display the machines that own both errors. All the other ones should disappear.
I will link both excel and power bi examples to make it easier to understand the problem.
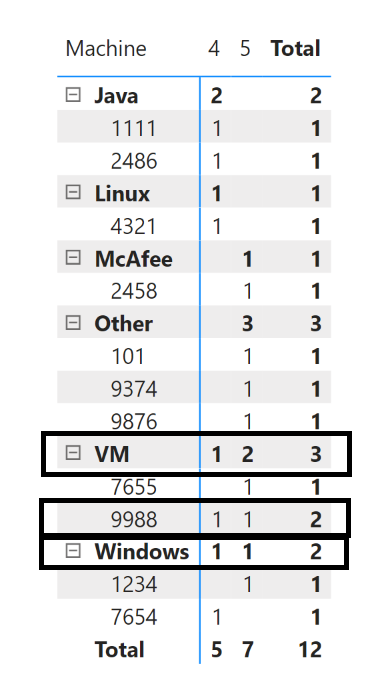
It should only display this ones:

Power Bi is not currently supported here on Q&A. The product group for Power Bi actively monitors questions over at
https://community.powerbi.com/
--please don't forget to upvote and  if the reply is helpful--