Hello,
My system was created bump file aftre BSOD.
So, i tried analysis with Windbg as below.
Please could you please let me know which H/W is the problem?
I think, the problems's root cause is Processor. is it right?
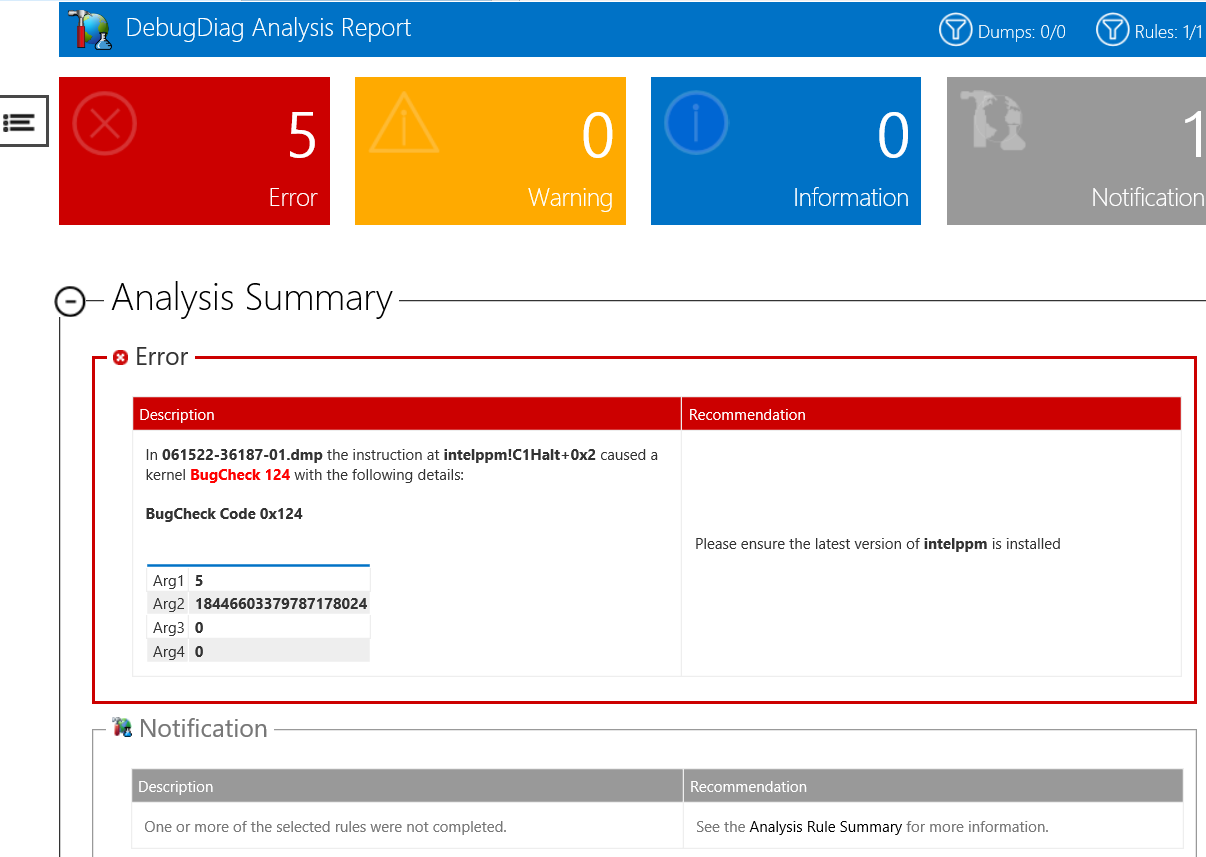
Also, I analyzed the dump using debugdiag.
============================================================
Microsoft (R) Windows Debugger Version 10.0.19041.685 AMD64
Copyright (c) Microsoft Corporation. All rights reserved.
Loading Dump File [C:\Users\kykwon\Desktop\061522-36187-01.dmp]
Mini Kernel Dump File: Only registers and stack trace are available
************* Path validation summary **************
Response Time (ms) Location
OK C:\symbols
Symbol search path is: C:\symbols
Executable search path is:
Windows 10 Kernel Version 14393 MP (32 procs) Free x64
Product: Server, suite: TerminalServer SingleUserTS
Built by: 14393.5125.amd64fre.rs1_release.220429-1732
Machine Name:
Kernel base = 0xfffff8007cc8a000 PsLoadedModuleList = 0xfffff8007cf8e040
Debug session time: Wed Jun 15 00:18:58.553 2022 (UTC + 9:00)
System Uptime: 0 days 3:59:35.221
Loading Kernel Symbols
...............................................................
................................................................
.......................................................
Loading User Symbols
Loading unloaded module list
.....
For analysis of this file, run !analyze -v
18: kd> !analyze -v
**
Bugcheck Analysis
**
WHEA_UNCORRECTABLE_ERROR (124)
A fatal hardware error has occurred. Parameter 1 identifies the type of error
source that reported the error. Parameter 2 holds the address of the
WHEA_ERROR_RECORD structure that describes the error conditon.
Arguments:
Arg1: 0000000000000005, Generic Error
Arg2: ffff800a24bc2028, Address of the WHEA_ERROR_RECORD structure.
Arg3: 0000000000000000
Arg4: 0000000000000000
Debugging Details:
------------------
fffff8007cf7bdf8: Unable to get Flags value from nt!KdVersionBlock
fffff8007cf7bdf8: Unable to get Flags value from nt!KdVersionBlock
fffff8007cf7bdf8: Unable to get Flags value from nt!KdVersionBlock
KEY_VALUES_STRING: 1
Key  : Analysis.CPU.Sec
Value: 1

Key  : Analysis.DebugAnalysisProvider.CPP
Value: Create: 8007007e on DESKTOP-LJL1SHO

Key  : Analysis.DebugData
Value: CreateObject

Key  : Analysis.DebugModel
Value: CreateObject

Key  : Analysis.Elapsed.Sec
Value: 1

Key  : Analysis.Memory.CommitPeak.Mb
Value: 78

Key  : Analysis.System
Value: CreateObject
BUGCHECK_CODE: 124
BUGCHECK_P1: 5
BUGCHECK_P2: ffff800a24bc2028
BUGCHECK_P3: 0
BUGCHECK_P4: 0
CUSTOMER_CRASH_COUNT: 1
PROCESS_NAME: System
STACK_TEXT:
ffffd38019256bd8 fffff8007cc44a9f : 0000000000000124 0000000000000005 ffff800a24bc2028 0000000000000000 : nt!KeBugCheckEx
ffffd38019256be0 fffff8007ceb7168 : ffff800a24bc2028 ffff800a24bbc000 ffff800a24bbc000 ffff800a24e0dbe0 : hal!HalBugCheckSystem+0xcf
ffffd38019256c20 fffff8007cc460f9 : 0000000000002140 0000000000000000 fffff8007cc5a8d0 0000000000000000 : nt!WheaReportHwError+0x258
ffffd38019256c80 fffff8007cc45943 : fffff8007d0456c0 ffffd38019256d30 0000000000000000 fffff8007cd5eab8 : hal!HalpNmiGenericErrorHandler+0x6d
ffffd38019256cb0 fffff8007cd5e3de : 0000000000000000 0000000000000000 0000000780086b37 fffff8007cd5e888 : hal!HalHandleNMI+0x23
ffffd38019256ce0 fffff8007cdf2342 : 0000000000000000 ffffd38019256ef0 0000000000000000 0000000000000000 : nt!KiProcessNMI+0x106
ffffd38019256d30 fffff8007cdf2143 : 0000000000000000 0000000000000000 0000000000000000 0000000000000000 : nt!KxNmiInterrupt+0x82
ffffd38019256e70 fffff802a8b02a12 : 0000000000000000 0000000000000000 0000000000000000 0000000000000000 : nt!KiNmiInterrupt+0x1c3
ffffd380191fb158 0000000000000000 : 0000000000000000 0000000000000000 0000000000000000 0000000000000000 : intelppm!C1Halt+0x2
MODULE_NAME: GenuineIntel
IMAGE_NAME: GenuineIntel.sys
STACK_COMMAND: .thread ; .cxr ; kb
FAILURE_BUCKET_ID: 0x124_GenuineIntel_PCIEXPRESS_SURPRISE_DOWN_ERROR
OS_VERSION: 10.0.14393.5125
BUILDLAB_STR: rs1_release
OSPLATFORM_TYPE: x64
OSNAME: Windows 10
FAILURE_ID_HASH: {c85d6f7d-7db4-1813-a22a-4d2cd25525d8}
Followup: MachineOwner
' cx='32' cy='32' r='32' /%3E%3Ctext x='50%25' y='55%25' dominant-baseline='middle' text-anchor='middle' fill='%23FFF' %3EHC%3C/text%3E%3C/svg%3E)