Azure Databricks
An Apache Spark-based analytics platform optimized for Azure.
This browser is no longer supported.
Upgrade to Microsoft Edge to take advantage of the latest features, security updates, and technical support.
' cx='32' cy='32' r='32' /%3E%3Ctext x='50%25' y='55%25' dominant-baseline='middle' text-anchor='middle' fill='%23FFF' %3ERH%3C/text%3E%3C/svg%3E)
Within databricks I am producing a plot using ggplot2 and wish to produce 2 plots side by side with grid.arrange
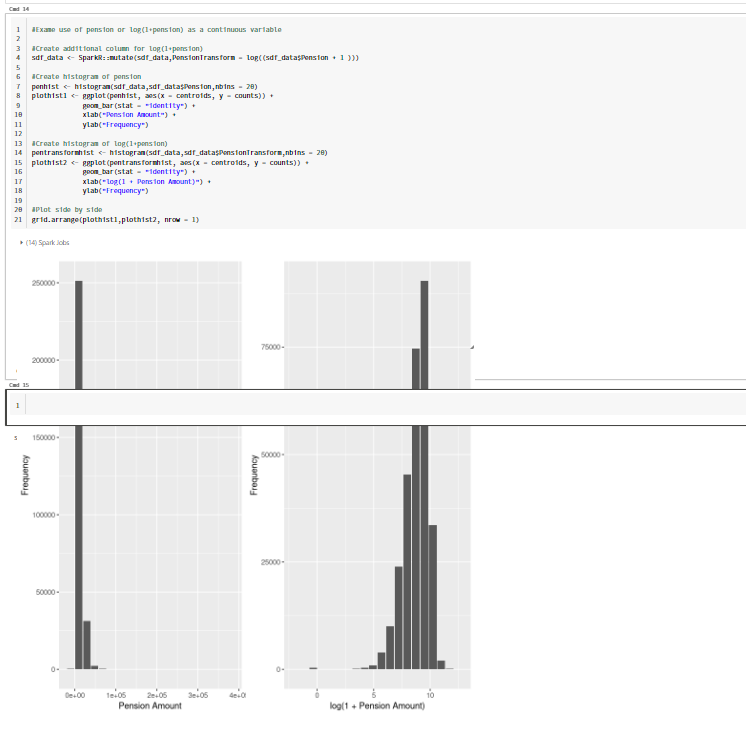
The plots work but the cell in databricks doesn't resize which creates for a confusing layout (note that I could also use the databricks display() function however when generating histograms using this function (in R) the histograms are displayed very small and I am unable to resize them.
The below is a screenshot of the issue:

Hello @Ross Hamilton ,
Thanks for the question and using MS Q&A platform.
In order to repro the above scenario, could you please share the below details:
Looking forward for your response.
Good morning and thank you for responding.
I can't provide the underlying dataframe to reproduce the data as it's a medium sized confidential dataset but the immediate code in the cell is as follows:
#Examine use of pension or log(1+pension) as a continuous variable

#Create additional column for log(1+pension) NAs set to 0 for those negative pensions
sdf_data <- SparkR::mutate(sdf_data,PensionTransform = log((sdf_data$Pension + 1 )))
sdf_data <- SparkR::fillna(sdf_data,list("PensionTransform" = 0))

#Create histogram of pension
penhist <- histogram(sdf_data,sdf_data$Pension,nbins = 20)
plothist1 <- ggplot(penhist, aes(x = centroids, y = counts)) +
             geom_bar(stat = "identity") +
             xlab("Pension Amount") +
             ylab("Frequency")

#Create histogram of log(1+pension)
pentransformhist <- histogram(sdf_data,sdf_data$PensionTransform,nbins = 20)
plothist2 <- ggplot(pentransformhist, aes(x = centroids, y = counts)) +
             geom_bar(stat = "identity") +
             xlab("log(1 + Pension Amount)") +
             ylab("Frequency")

#Plot side by side
grid.arrange(plothist1,plothist2, nrow = 1)
The databricks runtime is 10.4 with Spark 3.2.1
Packages loaded in the notebook are: SparkR, tidyverse, ggplot2, stats, gridExtra
I have also attempted to create a reprodicble dataframe with the issue but the issue does not appear when I have created this in a new notebook
Hello @Ross Hamilton ,
As per the repro from our end, we are getting the excepted output. Could you please try and do let us know?