SQL Server
A family of Microsoft relational database management and analysis systems for e-commerce, line-of-business, and data warehousing solutions.
12,708 questions
This browser is no longer supported.
Upgrade to Microsoft Edge to take advantage of the latest features, security updates, and technical support.

i have two computers running mssql 2019, yesterday i engaged an error which said try to access a closed connection (on the computer which recently installed mssql), and i read the log, found there is two sqldump
2022-06-22 01:17:05.37 Server CImageHelper::Init () Version-specific dbghelp.dll is not used
2022-06-22 01:17:05.38 Server Using 'dbghelp.dll' version '4.0.5'
2022-06-22 01:17:05.41 Server **Dump thread - spid = 0, EC = 0x0000000000000000
2022-06-22 01:17:05.41 Server ***Stack Dump being sent to C:\Program Files\Microsoft SQL Server\MSSQL15.MSSQLSERVER\MSSQL\LOG\SQLDump0001.txt
2022-06-22 01:17:05.41 Server * *******************************************************************************
2022-06-22 01:17:05.41 Server *
2022-06-22 01:17:05.41 Server * BEGIN STACK DUMP:
2022-06-22 01:17:05.41 Server * 06/22/22 01:17:05 spid 9960
2022-06-22 01:17:05.41 Server *
2022-06-22 01:17:05.41 Server * Non-yielding Scheduler
2022-06-22 01:17:05.41 Server *
2022-06-22 01:17:05.41 Server * *******************************************************************************
2022-06-22 01:17:05.41 Server * -------------------------------------------------------------------------------
2022-06-22 01:17:05.41 Server * Short Stack Dump
2022-06-22 01:17:05.42 Server Stack Signature for the dump is 0x000000000000006F
2022-06-22 01:23:27.45 Server Timeout waiting for external dump process 5936.
2022-06-22 01:23:27.45 Server Process 0:0:0 (0x6a04) Worker 0x000002933D06E160 appears to be non-yielding on Scheduler 11. Thread creation time: 13300270674753. Approx Thread CPU Used: kernel 4171 ms, user 0 ms. Process Utilization 2%. System Idle 83%. Interval: 72709 ms.
2022-06-22 01:23:27.46 Server **Dump thread - spid = 0, EC = 0x0000000000000000
2022-06-22 01:23:27.46 Server ***Stack Dump being sent to C:\Program Files\Microsoft SQL Server\MSSQL15.MSSQLSERVER\MSSQL\LOG\SQLDump0002.txt
2022-06-22 01:23:27.46 Server * *******************************************************************************
2022-06-22 01:23:27.46 Server *
2022-06-22 01:23:27.46 Server * BEGIN STACK DUMP:
2022-06-22 01:23:27.46 Server * 06/22/22 01:23:27 spid 9960
2022-06-22 01:23:27.46 Server *
2022-06-22 01:23:27.46 Server * Stalled Resource Monitor
2022-06-22 01:23:27.46 Server *
2022-06-22 01:23:27.46 Server * *******************************************************************************
2022-06-22 01:23:27.46 Server * -------------------------------------------------------------------------------
2022-06-22 01:23:27.46 Server * Short Stack Dump
2022-06-22 01:23:27.46 Server Stack Signature for the dump is 0x000000000000006F
2022-06-22 01:24:27.76 Server Timeout waiting for external dump process 26396.
2022-06-22 01:24:27.77 Server Resource Monitor (0x4a18) Worker 0x00000291724D0160 appears to be non-yielding on Node 0. Memory freed: 240 KB. Last wait: MISCELLANEOUS. Last clerk: type MEMORYCLERK_SLOG, name SLOG_DB_ID_1. Approx CPU Used: kernel 19906 ms, user 0 ms, Interval: 528765.
and the txt file is:
Current time is 01:17:05 06/22/22.
=====================================================================
BugCheck Dump
=====================================================================
This file is generated by Microsoft SQL Server
version 15.0.4223.1
upon detection of fatal unexpected error. Please return this file,
the query or program that produced the bugcheck, the database and
the error log, and any other pertinent information with a Service Request.
Computer type is 11th Gen Intel(R) Core(TM) i7-11800H @ 2.30GHz.
Bios Version is LENOVO - 1
H1CN33WW
16 X64 level 8664, 10 Mhz processor (s).
Windows NT 10.0 Build 19044 CSD .
Memory
MemoryLoad = 76%
Total Physical = 65319 MB
Available Physical = 15617 MB
Total Page File = 65319 MB
Available Page File = 12729 MB
Total Virtual = 134217727 MB
Available Virtual = 134123659 MB
Dump thread - spid = 0, EC = 0x0000000000000000
Stack Dump being sent to C:\Program Files\Microsoft SQL Server\MSSQL15.MSSQLSERVER\MSSQL\LOG\SQLDump0001.txt
**
**
BEGIN STACK DUMP:
06/22/22 01:17:05 spid 9960
Non-yielding Scheduler
**
------------------------------------------------------------------------------- Short Stack Dump
the version is 15.0.4223.1 while that dump happens, with CU16. (that's a win10 laptop, no third-part AV software, only windows defender)
And today i found there are totally 236 dumps on the other computer (2020 to now), and the last dump SQLDump0236 is happened on 13:53:35 06/18/22, its latest version (version 15.0.4236.7)
2022-06-18 13:53:34.97 Server CImageHelper::Init () Version-specific dbghelp.dll is not used
2022-06-18 13:53:34.97 Server Using 'dbghelp.dll' version '4.0.5'
2022-06-18 13:53:35.34 Server ***Unable to get thread context for spid 0
2022-06-18 13:53:35.34 Server * *******************************************************************************
2022-06-18 13:53:35.34 Server *
2022-06-18 13:53:35.34 Server * BEGIN STACK DUMP:
2022-06-18 13:53:35.34 Server * 06/18/22 13:53:35 spid 11568
2022-06-18 13:53:35.34 Server *
2022-06-18 13:53:35.34 Server * Non-yielding Scheduler
2022-06-18 13:53:35.34 Server *
2022-06-18 13:53:35.34 Server * *******************************************************************************
2022-06-18 13:53:35.34 Server Stack Signature for the dump is 0x00000000000001FD
i have try to follow the guide, use windbg to debug the sqldump (its the first dump i posted, not the one above, because there is no processid, so i cant use ~~[processid]s to get the context)
this is the windbg output:
You can troubleshoot most symbol related issues by turning on symbol loading diagnostics (!sym noisy) and repeating the command that caused symbols to be loaded.
You should also verify that your symbol search path (.sympath) is correct.
0:006> lmvm sqlservr
Browse full module list
start end module name
00007ff7de0f0000 00007ff7de18f000 sqlservr (pdb symbols) c:\websymbols\sqlservr.pdb\CA3331C7C97D45EB8F1EE31199202EF02\sqlservr.pdb
Loaded symbol image file: sqlservr.exe
Mapped memory image file: C:\Program Files\Microsoft SQL Server\MSSQL15.MSSQLSERVER\MSSQL\Binn\sqlservr.exe
Image path: C:\Program Files\Microsoft SQL Server\MSSQL15.MSSQLSERVER\MSSQL\Binn\sqlservr.exe
Image name: sqlservr.exe
Browse all global symbols functions data
Timestamp: Tue Apr 12 08:42:49 2022 (6254CB09)
CheckSum: 000A796C
ImageSize: 0009F000
File version: 2019.150.4223.1
Product version: 15.0.4223.1
File flags: 0 (Mask 3F)
File OS: 40004 NT Win32
File type: 0.0 Unknown
File date: 00000000.00000000
Translations: 0409.04b0
Information from resource tables:
CompanyName: Microsoft Corporation
ProductName: Microsoft SQL Server
InternalName: SQLSERVR
OriginalFilename: SQLSERVR.EXE
ProductVersion: 15.0.4223.1
FileVersion: 2019.0150.4223.01 ((SQL19_RTM_QFE-CU).220411-2306)
FileDescription: SQL Server Windows NT - 64 Bit
LegalCopyright: Microsoft. All rights reserved.
LegalTrademarks: Microsoft SQL Server is a registered trademark of Microsoft Corporation.
Comments: SQL
0:006> !findstack sqlservr!SQL_SOSNonYieldSchedulerCallback
Thread 006, 1 frame(s) match
* 09 0000009786dfd820 00007ffb95c768a0 sqlservr!SQL_SOSNonYieldSchedulerCallback+0x465
0:006> ~[006]s
ntdll!NtWaitForSingleObject+0x14:
00007ffb`b202cdc4 c3 ret
0:006> kP
00 0000009786ddb7c8 00007ffbaf7c1ace ntdll!NtWaitForSingleObject+0x14
01 0000009786ddb7d0 00007ff7de11bb2e KERNELBASE!WaitForSingleObjectEx+0x8e
02 0000009786ddb870 00007ff7de11b8a3 sqlservr!CDmpDump::InvokeSqlDumper+0x1ee
03 0000009786ddb970 00007ff7de11b5a4 sqlservr!CDmpDump::DumpInternal+0x1b3
04 0000009786ddba20 00007ffb9649dff3 sqlservr!CDmpDump::Dump+0x24
05 0000009786ddba60 00007ffb9713c105 sqllang!SQLDumperLibraryInvoke+0x1f3
06 0000009786ddbaa0 00007ffb9713cf96 sqllang!SQLLangDumperLibraryInvoke+0x185
07 0000009786ddbb60 00007ffb97107b92 sqllang!CImageHelper::DoMiniDump+0x6f6
08 0000009786ddbd80 00007ff7de0f3eb5 sqllang!stackTrace+0xa42
09 0000009786ddd7a0 00007ffb95c768a0 sqlservr!SQL_SOSNonYieldSchedulerCallback+0x465
0a 0000009786dfda40 00007ffb95c4e42b sqldk!SOS_OS::ExecuteNonYieldSchedulerCallbacks+0xe0
0b 0000009786dfdcf0 00007ffb95be8ef2 sqldk!SOS_Scheduler::ExecuteNonYieldSchedulerCallbacks+0x1ab
0c 0000009786dfded0 00007ffb95be7ee2 sqldk!SchedulerMonitor::CheckScheduler+0x25e
0d 0000009786dfe070 00007ffb95be78f2 sqldk!SchedulerMonitor::CheckSchedulers+0x1ea
0e 0000009786dfe9e0 00007ffb95ce4819 sqldk!SchedulerMonitor::Run+0xc2
0f 0000009786dfeae0 00007ffb95bd9e43 sqldk!SchedulerMonitor::EntryPoint+0x9
10 0000009786dfeb10 00007ffb95bda48f sqldk!SOS_Task::Param::Execute+0x232
11 0000009786dff110 00007ffb95bda04e sqldk!SOS_Scheduler::RunTask+0xbf
12 0000009786dff180 00007ffb95bf5482 sqldk!SOS_Scheduler::ProcessTasks+0x39d
13 0000009786dff2a0 00007ffb95bf4d2f sqldk!SchedulerManager::WorkerEntryPoint+0x2a1
14 0000009786dff370 00007ffb95bf52ba sqldk!SystemThreadDispatcher::ProcessWorker+0x42a
15 0000009786dff670 00007ffbb09d7034 sqldk!SchedulerManager::ThreadEntryPoint+0x406
16 0000009786dff760 00007ffbb1fe2651 kernel32!BaseThreadInitThunk+0x14
17 0000009786dff790 0000000000000000 ntdll!RtlUserThreadStart+0x21
0:006> ~~[0x6a04]s
ntdll!NtWaitForSingleObject+0x14:
00007ffb`b202cdc4 c3 ret
0:105> kc 10
00 ntdll!NtWaitForSingleObject
01 KERNELBASE!WaitForSingleObjectEx
02 sqldk!SOS_Scheduler::SwitchContext
03 sqldk!SOS_Scheduler::SuspendNonPreemptive
04 sqldk!WaitableBase::Wait
05 sqldk!WorkDispatcher::DequeueTask
06 sqldk!SOS_Scheduler::ProcessTasks
07 sqldk!SchedulerManager::WorkerEntryPoint
08 sqldk!SystemThreadDispatcher::ProcessWorker
09 sqldk!SchedulerManager::ThreadEntryPoint
0a kernel32!BaseThreadInitThunk
0b ntdll!RtlUserThreadStart
0:105> X sqlmin!copiedStack
00007ffb36ccfc20 sqlmin!g_copiedStackInfo = <no type information> 0:105> dd sqlmin!g_copiedStackInfo 00007ffb36ccfc20 00000001 00000005 00000000 00000000
00007ffb36ccfc30 86ddd810 00000097 00007238 00000000 00007ffb36ccfc40 00000000 00000000 00000000 00000000
00007ffb36ccfc50 00000000 00000000 00000000 00000000 00007ffb36ccfc60 00000000 00000000 00000000 00000000
00007ffb36ccfc70 0010000b 00001fa2 00000033 00000000 00007ffb36ccfc80 002b0000 00000246 00000000 00000000
00007ffb36ccfc90 00000000 00000000 00000000 00000000 0:105> dt 00007ffb36ccfc20 CONTEXT Rip Rsp Rbp
clrjit!CONTEXT
+0x098 Rsp : 3
+0x0a0 Rbp : 0x0000009786ddd9f8 +0x0f8 Rip : 0x0000029171380000
0:105> dt 00007ffb36ccfc30 CONTEXT Rip Rsp Rbp clrjit!CONTEXT +0x098 Rsp : 2 +0x0a0 Rbp : 0x00000291722d0100
+0x0f8 Rip : 0x00000291f7230000 0:105> dt 00007ffb36ccfc40 CONTEXT Rip Rsp Rbp
clrjit!CONTEXT
+0x098 Rsp : 0x0000009786ddd810 +0x0a0 Rbp : 0x0000009786ddd898
+0x0f8 Rip : 0x00007ffbb202cda4 0:105> dt 00007ffb36ccfc50 CONTEXT Rip Rsp Rbp
clrjit!CONTEXT
+0x098 Rsp : 0x00000291f7237000 +0x0a0 Rbp : 2 +0x0f8 Rip : 0 0:105> dt 00007ffb36ccfc60 CONTEXT Rip Rsp Rbp
clrjit!CONTEXT
+0x098 Rsp : 0x000002958caed370 +0x0a0 Rbp : 0x00000294e2148060
+0x0f8 Rip : 0x0000ffff00001fa2 0:105> dt 00007ffb36ccfc70 CONTEXT Rip Rsp Rbp
clrjit!CONTEXT
+0x098 Rsp : 0x820
+0x0a0 Rbp : 0x00000294e2148060 +0x0f8 Rip : 0 0:105> .cxr 00007ffb36ccfc40
rax=0000000000000003 rbx=00000291722d0100 rcx=0000009786ddd9f8
rdx=0000000000000002 rsi=00000291f7237000 rdi=0000000000000002
rip=00007ffbb202cda4 rsp=0000009786ddd810 rbp=0000009786ddd898
r8=000002958caed370 r9=00000294e2148060 r10=0000000000000820
r11=00000294e2148060 r12=0000029171380000 r13=0000000000000007
r14=00000291f7230000 r15=0000000000000002
iopl=0 nv up ei pl zr na po nc
cs=0033 ss=002b ds=0000 es=0000 fs=0000 gs=0000 efl=00000246
ntdll!NtMapUserPhysicalPagesScatter+0x14:
00007ffb`b202cda4 c3 ret
0:105> Kc
*** Stack trace for last set context - .thread/.cxr resets it
00 ntdll!NtMapUserPhysicalPagesScatter
01 kernel32!MapUserPhysicalPagesScatter
02 sqldk!SOS_MemoryBlockAllocator::CommitBlockAndCheckNumaLocality
03 sqldk!SOS_MemoryBlockAllocator::AllocateBlock
04 sqldk!SOS_MemoryWorkSpace::AllocatePage
05 sqldk!MemoryNode::AllocatePagesInternal
06 sqldk!MemoryClerkInternal::AllocatePagesWithFailureMode
07 sqldk!MemoryClerkInternal::AllocatePages
08 sqllang!CCacheStoreWrappingPageAllocator::AllocatePages
09 sqldk!CIncPageMgr::PbAllocateWithNewPage
0a sqldk!CMemProc::Alloc
0b sqldk!operator new[]
0c sqlmin!CPrefetchMgr::CreateBuffer
0d sqlmin!CPrefetchMgr::SetupPrefetch
0e sqlmin!CQScanRangeNew::CQScanRangeNew
0f sqlmin!CXteRange::QScanGetHelper
10 sqlmin!CXteRange::QScanGet
11 sqlmin!CQueryScan::InitQScanRoot
12 sqlmin!CQueryScan::Setup
13 sqlmin!CQuery::CreateExecPlan
14 sqllang!CXStmtQuery::SetupQueryScanAndExpression
15 sqllang!CXStmtQuery::InitForExecute
16 sqllang!CXStmtQuery::ErsqExecuteQuery
17 sqllang!CXStmtSelect::XretExecute
18 sqllang!CMsqlExecContext::ExecuteStmts<0,1>
19 sqllang!CMsqlExecContext::FExecute
1a sqllang!CSQLSource::Execute
1b sqllang!CStmtPrepQuery::XretPrepQueryExecute
1c sqllang!CMsqlExecContext::ExecuteStmts<1,1>
1d sqllang!CMsqlExecContext::FExecute
1e sqllang!CSQLSource::Execute
1f sqllang!process_request
20 sqllang!process_commands_internal
21 sqllang!process_messages
22 sqldk!SOS_Task::Param::Execute
23 sqldk!SOS_Scheduler::RunTask
24 sqldk!SOS_Scheduler::ProcessTasks
25 sqldk!SchedulerManager::WorkerEntryPoint
26 sqldk!SystemThreadDispatcher::ProcessWorker
27 sqldk!SchedulerManager::ThreadEntryPoint
28 kernel32!BaseThreadInitThunk
29 ntdll!RtlUserThreadStart
both mssql has already turn on the previllege of lock memory pages. I don't understand what the debug output indicates.
' cx='32' cy='32' r='32' /%3E%3Ctext x='50%25' y='55%25' dominant-baseline='middle' text-anchor='middle' fill='%23FFF' %3ESX%3C/text%3E%3C/svg%3E)
We have not received a response from you. Did the reply could help you? If the response helped, do "Accept Answer". If it doesn't work, please let us know the progress. By doing so, it will benefit all community members who are having this similar issue. Your contribution is highly appreciated.
Best regards,
Seeya

I would recommend that you open a support case with Microsoft. A non-yielding scheduler is usually a symptom of a defect in the product.
Debugging SQL Server is not for the faint of heart. I've seen Bob Ward doing in in presentations, but I would never try it myself.
sorry, but i dont know where to open a support case..
<Cough>I don't really know that myself, either. In all my career with SQL Server someone else has taken care of that work.</Cough>
But a start is to have a support contract. I'm not sure it is required, but it certainly helps. If you are in a larger organization, there are probably people who knows all the required details.
If you are a one-man-band, it can be more difficult. Still, a non-yielding scheduler is something you rarely sort out on your own.
I've just send a support request on microsoft 365 admin center.
Welcome to Microsoft Q&A!
02 sqldk!SOS_Scheduler::SwitchContext
03 sqldk!SOS_Scheduler::SuspendNonPreemptive
This is a SwitchContext on the thread stack which means that the thread has yielded. SQL Server detected a non-yielding worker thread. By the time, SQL Dumper was initiated to capture a memory dump of the SQL Server process, the thread yielded and the processing moved on to the next work request in the queue. SwitchPreemptive or SuspendNonPreemptive forces another worker to become owner of the scheduler.
Please refer to this article: https://mssqlwiki.com/2012/08/17/how-to-analyze-non-yielding-scheduler-dumps/
Best regards,
Seeya
If the answer is the right solution, please click "Accept Answer" and kindly upvote it. If you have extra questions about this answer, please click "Comment".
Note: Please follow the steps in our documentation to enable e-mail notifications if you want to receive the related email notification for this thread.
i have already follow this guide, and i've posted the windbg stack output. (at the end of the first post)
00 ntdll!NtMapUserPhysicalPagesScatter
01 kernel32!MapUserPhysicalPagesScatter
02 sqldk!SOS_MemoryBlockAllocator::CommitBlockAndCheckNumaLocality
though the LPIM is enabled, and the NtMapUserPhysicalPagesScatter may indicate it's running with AWE, but the non-yielding scheduler is happened. (with low kernel time)
that's why i'm confused.
What is the result of your "select @@version", if it is not the latest, please install the latest CU.
The latest known CU for SQL Server 2019 is CU16.
Best regards,
Seeya
If the answer is the right solution, please click "Accept Answer" and kindly upvote it.
the txt files already mentioned the version, its the latest, CU16.
Hi @DreamProtocol REMILIA ,,
Hope everything goes well. Here is a feedback site for you: https://feedback.azure.com/d365community/forum/04fe6ee0-3b25-ec11-b6e6-000d3a4f0da0
Best regards,
Seeya
If the answer is the right solution, please click "Accept Answer" and kindly upvote it.
after that issue, i've found another one, on my laptop, high cpu usage happened on sqlserver of my laptop at every tuesday evening. (since 8:00 pm) and it can keep long time, for about 9 hours or more. during that time, i have run the profiler, it display no long duration and high cpu querys (no problems found), and i pick the threads which has cpu usage, most of it stack contains the MmTrimAllSystemPagableMemory. but if i closed the LPIM, the usage become low (normal), but i notice the usage is still higher than normal.
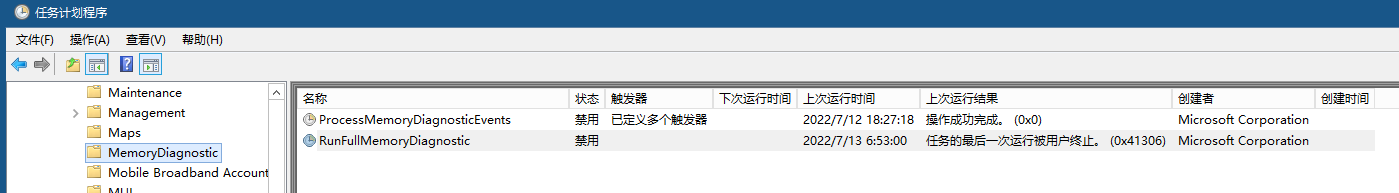
i discover more, found last time when this issue happens, there is a thread in 'System' process, which calling the RtlScrubMemory, MiScrubMemory, this is planned by 'Microsoft\Windows\MemoryDiagnostic\RunFullMemoryDiagnostic'. then disabled both RunFullMemoryDiagnostic and ProcessMemoryDiagnosticEvents on both computer, after that, this issue never happened, and seems on my desktop computer, sqlserver no longer engaged the 'Non-yielding scheduler'.
but if i closed the LPIM,
I'm not sure what you mean here. But if you mean to say that you revoked the Windows permission Lock Pages in Memory from the service account for SQL Server, that was the right thing to do.
To wit, granting SQL Server Lock Pages in Memory is a very good idea on a server which is dedicated to run SQL Server only. But you say "laptop", and on laptops you typically run a lot of different things. And you rarely run production workloads on SQL Server. Thus, on a laptop, you want SQL Server to be just like anyone else, and you want it to be swapped out, if Windows is getting short of memory. Assigning LPIM to it, can certainly lead to problems.
but if i closed the LPIM, i can get other problem, even i adjust the size page file size to 0, after some hours, the committed size of sqlserver is 8gb, but workingset is 1~2gb. then even when the sqlserver is idle, it consume cpu 20~30% for 5~6 seconds, every one minute once (during that seconds, all the query is blocked). if the LPIM turn on, so there will no this problem. i don't found other problem during the LPIM is on. and this time seems the fullmemorydiagnostic is running, the sqlserver (turned on the LPIM) will be impacted.
How much memory do you have on your laptop in total? For a laptop, it is definitely recommendable to set "max server memory" to make sure that SQL Server does not take over the machine.
oh, the problem.
but if i closed the LPIM, i can get other problem, even i adjust the size page file size to 0, after some hours, the committed size of sqlserver is 8gb, but workingset is 1~2gb. then even when the sqlserver is idle, it consume cpu 20~30% for 5~6 seconds, every one minute once (during that seconds, all the query is blocked). if the LPIM turn on, so there will no this problem.
this is not on my laptop, at least i cant confirm this has the same issue on my laptop, but i do found the workingset much smaller than the commit size, on my laptop its 64g memory, and i limit the size to 25G for sqlserver, and the memory commited percent usually at 90%.
and the issue i mentioned its happened on my desktop, it has 128g memory, i limit the max size of sqlserver memory is 8gb. (and the commit memory percent is 75~90%)
i do a lot of other works on my desktop, play games and watch videos, etc.