Microsoft 365 and Office | Excel | For business | Windows
A family of Microsoft spreadsheet software with tools for analyzing, charting, and communicating data
This browser is no longer supported.
Upgrade to Microsoft Edge to take advantage of the latest features, security updates, and technical support.
' cx='32' cy='32' r='32' /%3E%3Ctext x='50%25' y='55%25' dominant-baseline='middle' text-anchor='middle' fill='%23FFF' %3ET%3C/text%3E%3C/svg%3E)
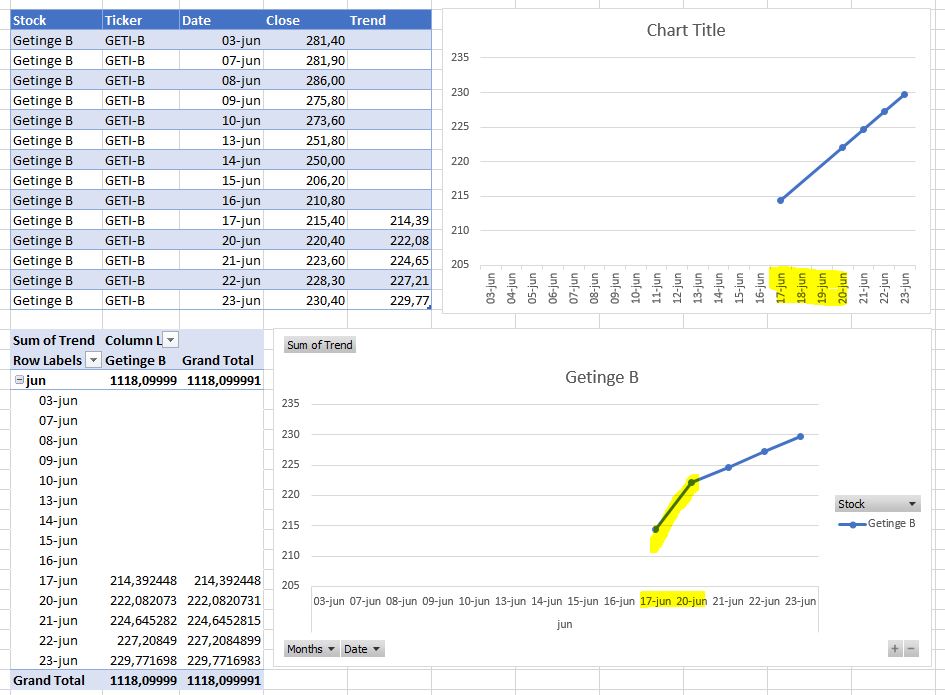
When I use line chart, the date-axis will be correct, adding missing dates as weekends.
But when I use Pivot table the same date data will not work, dates are treated as text.
I use the same line chart i both cases. Line chart and Pivot line chart.
I use linear regression to calculate the trend from the closing price. The line should be a straight line as in the top chart.
How can I fix the date axis in the Pivot chart? Or is this a dead end (bug).
 215025-stocktrend.txt

Hi @TomHam ,
This is by default behavior in PivotTable, I tested the Group feature, grouped by the Days and Months:
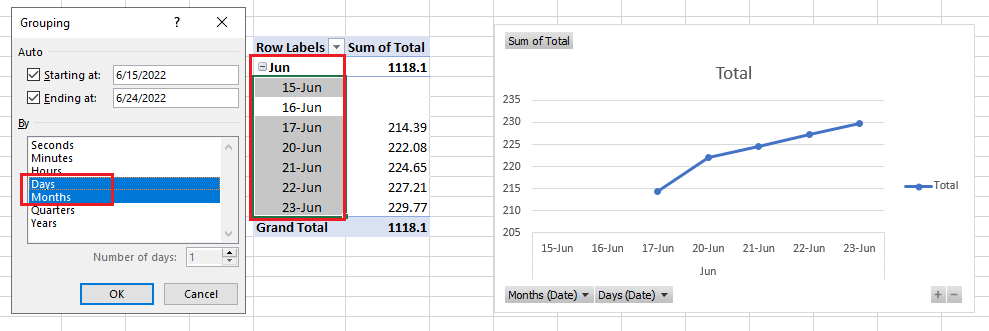
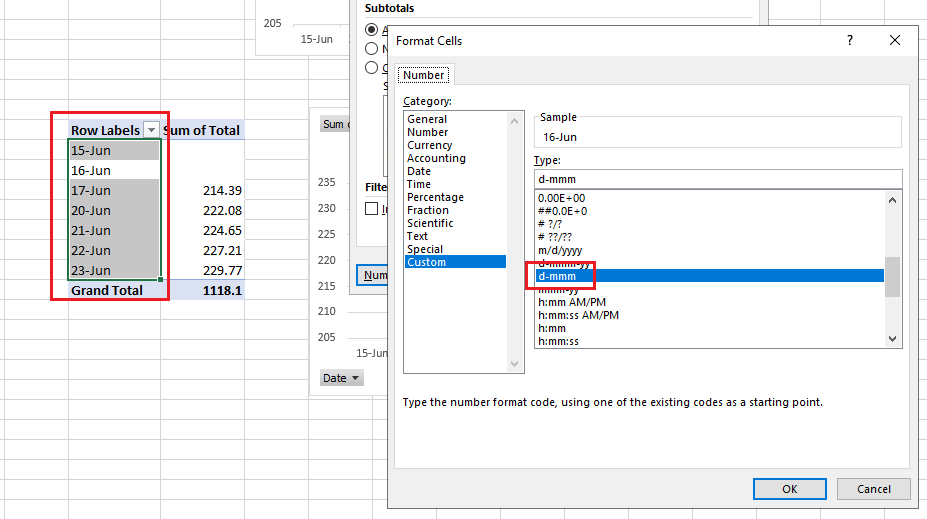
"dates are treated as text" No, it is not treated as Text, as you can see it is formatted as Date:
You should change the source data, add all days in table.
If the response is helpful, please click "Accept Answer" and upvote it.
Note: Please follow the steps in our documentation to enable e-mail notifications if you want to receive the related email notification for this thread.
' cx='32' cy='32' r='32' /%3E%3Ctext x='50%25' y='55%25' dominant-baseline='middle' text-anchor='middle' fill='%23FFF' %3EHS%3C/text%3E%3C/svg%3E)
Excel 365 Pro Plus with Power Query and Power Pivot.
Trend with discontinuous data.
https://www.mediafire.com/file/jcy1lvjj18dtm5r/06_26_22.xlsx/file
https://www.mediafire.com/file/4jms38ch648d2g8/06_26_22.pdf/file
OK, so pivot chart is a dead end. I already moved back to ordinary chart (not pivot) and it works. Chart interpolate(?) the missing dates and it is quite fast (I thought pivot chart would be faster with big-data). I will miss the time slicer in pivot chart, but I might be able to fix that with some VBA. Thanks for replay.