Azure Maps
An Azure service that provides geospatial APIs to add maps, spatial analytics, and mobility solutions to apps.
834 questions
This browser is no longer supported.
Upgrade to Microsoft Edge to take advantage of the latest features, security updates, and technical support.
' cx='32' cy='32' r='32' /%3E%3Ctext x='50%25' y='55%25' dominant-baseline='middle' text-anchor='middle' fill='%23FFF' %3EHA%3C/text%3E%3C/svg%3E)
Hello My question is that in choropleth map how can I change multiple colors when I click multiple tab buttons.

Can you provide a lot more detail on what you want to achieve? This is not clear. Choropleth mapping is easy to do, and changing colors is too. Can you describe the user experience you are trying to achieve?
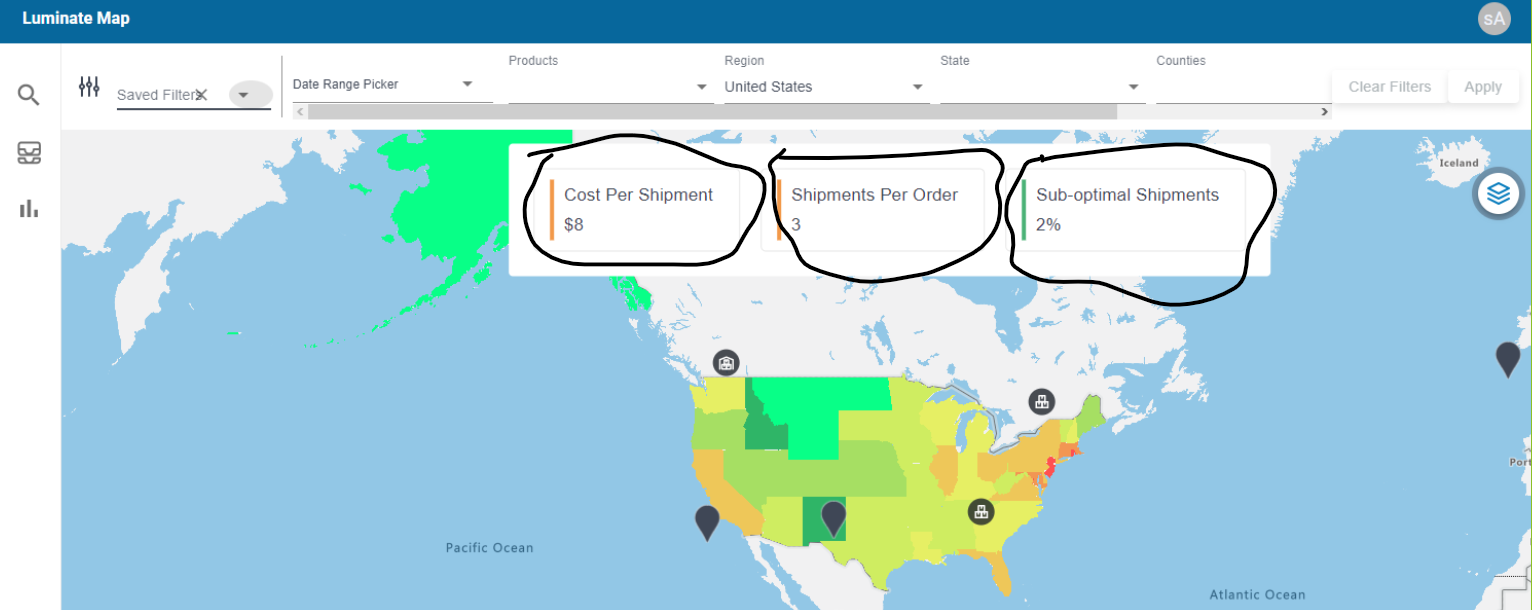
Hello thank you for reaching out to me my question is that I attached a file if you are able to see if not let me know. So basically when user click on these tabs the multi colors map will be change into another multi colors so my question is that when we click to different tabs as shown in screenshot if you able to see so how I can change because I don't have any kind of multi color map change on click docs.
' cx='32' cy='32' r='32' /%3E%3Ctext x='50%25' y='55%25' dominant-baseline='middle' text-anchor='middle' fill='%23FFF' %3EQ%3C/text%3E%3C/svg%3E)
Hello @Hassan Aftab (CW) Just checking back, could you please let us know if you need further help in this matter.
Please accept the helpful response as 'Answer', which will be helpful to others as well with similar questions.
Ok, so it looks like you have three different buttons (tabs), each for a different metric in your data. When one is pressed, you want the related metric to be used to change the color on the map. There are many different ways to do.
fillColor setting of the polygon layer with a new data driven expression based on the metric you want to use. I recommend doing #1, and if need be, join the metrics to the shapes ahead of time (loop through shapes and add related metrics to the properties of the shape).
There are many different ways to create data driven styles, as documented here: https://learn.microsoft.com/en-us/azure/azure-maps/data-driven-style-expressions-web-sdk
The first thing you will need to do is determine the min/max range of your data metrics, what color you want to make the metrics, and if you want to use a gradient scale or a stepped scale (a range of values would have the same color).
Below I'll put together an example where I made the following assumptions (mainly to show the different styling methods):
Properties for each shape:
cost - The cost per shipment. Min: 0, Max: 100. Use a gradient scale since the values can be floats. orderSize - Shipments per order. Min: 0, Max: 10 (Anything larger than 10 will be the same color as 10, and thus that color would represent 10). Use a stepped color scale since the values would be integers. suboptimal - The sub-optimal shipments percentage value. Min: 0, Max: 1. Use a gradient scale since the values can be floats. I'll bring in state boundary data and do a join on the data with custom metrics at run time before rendering it. This can be skipped if your shape data already has the metrics in the properties of the shapes.
Here is an example of what a single shape data might look like.
   {
   	type: 'Feature',
   	properties: {
   		cost: 8.53,
   		orderSize: 3,
   		suboptimal: 2
   	},
   	geometry: ...
   }
Here is the full example:
   <!DOCTYPE html>
   <html lang="en">
   <head>
       <title></title>
       <meta charset="utf-8" />
       <meta name="viewport" content="width=device-width, initial-scale=1, shrink-to-fit=no" />

       <!-- Add references to the Azure Maps Map control JavaScript and CSS files. -->
       <link href="https://atlas.microsoft.com/sdk/javascript/mapcontrol/2/atlas.min.css" rel="stylesheet" />
       <script src="https://atlas.microsoft.com/sdk/javascript/mapcontrol/2/atlas.min.js"></script>

       <script>
           var map, datasource, polygonLayer;

   		//Link to shape boundaries. Note I'm using a CORs proxy for this example. For security, you should host this data in your site on the same domain.
   		var stateBoundaries = 'https://corsproxy.io/?https://samples.azuremaps.com/data/geojson/US_States_500k.json';

   		var metrics = {
   			'Alabama': {cost:42.93,orderSize:1,suboptimal:0.57},
   			'Alaska': {cost:41.53,orderSize:5,suboptimal:0.17},
   			'Arizona': {cost:28.24,orderSize:9,suboptimal:0.61},
   			'Arkansas': {cost:56.3,orderSize:1,suboptimal:0.11},
   			'California': {cost:19.22,orderSize:4,suboptimal:0.34},
   			'Colorado': {cost:40.22,orderSize:9,suboptimal:0.33},
   			'Connecticut': {cost:98.21,orderSize:6,suboptimal:0.19},
   			'Delaware': {cost:34.1,orderSize:0,suboptimal:0.47},
   			'District of Columbia': {cost:9.21,orderSize:1,suboptimal:0.85},
   			'Florida': {cost:15.5,orderSize:5,suboptimal:0.03},
   			'Georgia': {cost:84.94,orderSize:5,suboptimal:0.66},
   			'Hawaii': {cost:77.04,orderSize:3,suboptimal:0.15},
   			'Idaho': {cost:64.58,orderSize:1,suboptimal:0.16},
   			'Illinois': {cost:1.95,orderSize:7,suboptimal:0.17},
   			'Indiana': {cost:33.37,orderSize:4,suboptimal:0.34},
   			'Iowa': {cost:2.91,orderSize:7,suboptimal:0.28},
   			'Kansas': {cost:65.32,orderSize:7,suboptimal:0.76},
   			'Kentucky': {cost:83.38,orderSize:6,suboptimal:0.88},
   			'Louisiana': {cost:15.16,orderSize:6,suboptimal:0.72},
   			'Maine': {cost:97.68,orderSize:8,suboptimal:0.74},
   			'Maryland': {cost:2.77,orderSize:3,suboptimal:0.94},
   			'Massachusetts': {cost:77.32,orderSize:9,suboptimal:0.58},
   			'Michigan': {cost:56.29,orderSize:6,suboptimal:0.93},
   			'Minnesota': {cost:0.74,orderSize:0,suboptimal:0.95},
   			'Mississippi': {cost:78.9,orderSize:8,suboptimal:0.74},
   			'Missouri': {cost:98.15,orderSize:0,suboptimal:0.37},
   			'Montana': {cost:47.73,orderSize:6,suboptimal:0.87},
   			'Nebraska': {cost:77.19,orderSize:10,suboptimal:0.12},
   			'Nevada': {cost:49.14,orderSize:9,suboptimal:0.79},
   			'New Hampshire': {cost:58.94,orderSize:10,suboptimal:0.48},
   			'New Jersey': {cost:92.78,orderSize:10,suboptimal:0.92},
   			'New Mexico': {cost:5.06,orderSize:0,suboptimal:0.01},
   			'New York': {cost:64.23,orderSize:1,suboptimal:0.29},
   			'North Carolina': {cost:24.49,orderSize:3,suboptimal:0.79},
   			'North Dakota': {cost:98.86,orderSize:1,suboptimal:0.16},
   			'Ohio': {cost:49.74,orderSize:10,suboptimal:0.38},
   			'Oklahoma': {cost:72.52,orderSize:9,suboptimal:0.5},
   			'Oregon': {cost:75.56,orderSize:1,suboptimal:0.83},
   			'Pennsylvania': {cost:26.49,orderSize:8,suboptimal:0.94},
   			'Puerto Rico': {cost:16.86,orderSize:8,suboptimal:0.31},
   			'Rhode Island': {cost:57.16,orderSize:1,suboptimal:0.59},
   			'South Carolina': {cost:98.85,orderSize:8,suboptimal:0.35},
   			'South Dakota': {cost:71.87,orderSize:2,suboptimal:0.7},
   			'Tennessee': {cost:2.96,orderSize:0,suboptimal:0.59},
   			'Texas': {cost:57.79,orderSize:2,suboptimal:0.75},
   			'Utah': {cost:28.42,orderSize:9,suboptimal:0.11},
   			'Vermont': {cost:43.45,orderSize:5,suboptimal:1},
   			'Virginia': {cost:79.34,orderSize:10,suboptimal:0.39},
   			'Washington': {cost:55.44,orderSize:1,suboptimal:0.76},
   			'West Virginia': {cost:71.95,orderSize:2,suboptimal:0.07},
   			'Wisconsin': {cost:52.35,orderSize:6,suboptimal:0.69},
   			'Wyoming': {cost:59.87,orderSize:10,suboptimal:0.16}
   		};

   		var styles = {

   			//A linear interpolation on cost from 0 (green) to 100+ (red), with the mid-point (50) being yellow.
   			cost: [
   				'interpolate',
   				['linear'],
   				['get', 'cost'],	//Grab the `cost` metric from the shapes properties.
   				0, 'green',
   				50, 'yellow',
   				100, 'red'
   			],

   			//A stepped color scale of ranges.
   			orderSize: [
   				'step',
   				['get', 'orderSize'],	//Grab the `orderSize` metric from the shapes properties.
   				'blue',			//<1
   				1, '#a6cee3',	//1 - 2
   				2, '#1f78b4',	//2 - 3
   				3, '#b2df8a',	//3 - 4
   				4, '#33a02c',	//4 - 5
   				5, '#fb9a99',	//5 - 6
   				6, '#e31a1c',	//6 - 7
   				7, '#fdbf6f',	//7 - 8
   				8, '#ff7f00',	//8 - 9
   				9, '#cab2d6',	//9 - 10
   				10, '#6a3d9a'	//10>
   			],

   			//A linear interpolation on the sub-optimal shipment percentage from 0 (green) to 1+ (red), with the mid-point (0.5) being yellow.
   			suboptimal: [
   				'interpolate',
   				['linear'],
   				['get', 'suboptimal'], //Grab the `suboptimal` metric from the shapes properties.
   				0, 'green',
   				0.5, 'yellow',
   				1, 'red'
   			]
   		};

           function GetMap() {
               //Initialize a map instance.
               map = new atlas.Map('myMap', {
                    center: [-94.6, 39.1],
                   zoom: 3,
                   view: 'Auto',

                   //Add authentication details for connecting to Azure Maps.
                   authOptions: {
                       authType: 'subscriptionKey',
                       subscriptionKey: '<Your Azure Maps Key>'
                   }
               });

               //Wait until the map resources are ready.
               map.events.add('ready', function () {

                   //Create a data source and add it to the map.
                   datasource = new atlas.source.DataSource();
                   map.sources.add(datasource);

   				//Load the US state boundary data, then join it with the metrics.
                   datasource.importDataFromUrl(stateBoundaries).then(joinMetrics);

                   //Add a layer for rendering filled polygon area.
                   polygonLayer = new atlas.layer.PolygonLayer(datasource);
   				map.layers.add(polygonLayer);

   				//Set default metric.
   				setMetric('cost');
               });
           }

   		function setMetric(metric){
   			//Update the fill color style option based on the metric.
   			polygonLayer.setOptions({ fillColor: styles[metric] });
   		}

   		function joinMetrics() {
   			datasource.getShapes().forEach(state => {
   				//Cross reference the state shapes with the metrics using the states NAME property.
   				//Join the metrics with the state shapes properties.
   				var props = state.getProperties();
   				Object.assign(props, metrics[props.NAME]);
   				state.setProperties(props);
   			});
   		}
       </script>
   	<style>
   	body, html, #myMap {
   		margin: 0;
   		padding:0;
   		width:100%;
   		height:100%;
   	}

   	.buttonPanel {
   		position: absolute;
   		top: 10px;
   		left:10px;
   	}

   	</style>
   </head>
   <body onload="GetMap()">
       <div id="myMap"></div>

   	<div class="buttonPanel">
   		<button onclick="setMetric('cost')">Cost per Shipment</button>
   		<button onclick="setMetric('orderSize')">Shipments per order</button>
   		<button onclick="setMetric('suboptimal')">Sub-optimal Shipments</button>
   	</div>
   </body>
   </html>
Thank you for this I will try and if I have any issue I will let you know.
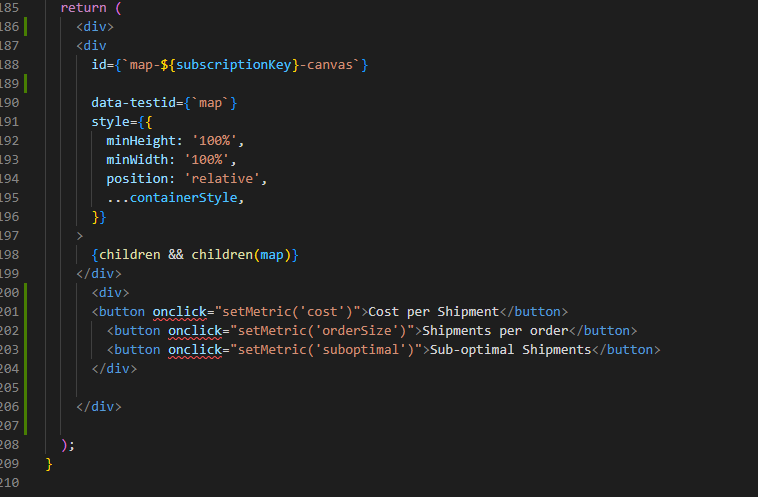
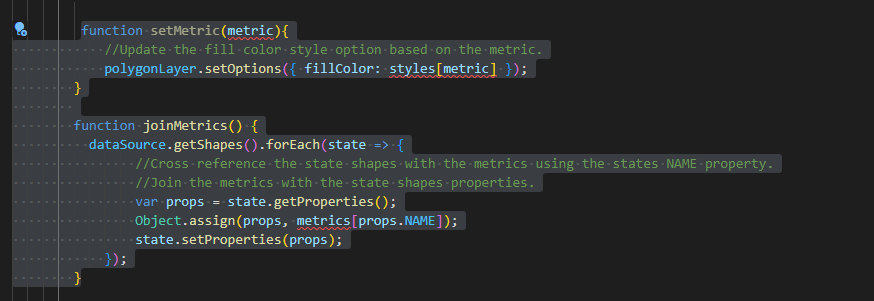
Hello for giving me this code I edit this code but I am facing some issues: setMetric function and joinMetrics function and also let you my project is react base typescript project could you please help me to solve this issue and I also write a whole code you can see on screenshot how can I return this function as a onclick button.
function setMetric(metric){
//Update the fill color style option based on the metric.
polygonLayer.setOptions({ fillColor: styles[metric] });
}
    function joinMetrics() {
      dataSource.getShapes().forEach(state => {
            //Cross reference the state shapes with the metrics using the states NAME property.
            //Join the metrics with the state shapes properties.
            var props = state.getProperties();
            Object.assign(props, metrics[props.NAME]);
            state.setProperties(props);
        });
    }
Hello this is your code and try to edit but not working got some issue as I mention on screenshot please and help me to fix this issue thank you.
You would swap out the button code I used and wire in your own click events from your tabs.
I don't have much experience with React but looking through your code I would move the setMetric/joinMetric functions outside of the useEffect code block so that they are more accessible. Then modify the code after your useEffect statements like this:
   costClicked =() {
   		setMetric('cost')
   	};

   	orderSizeClicked = () => {
   		setMetric('orderSize')
   	};

   	suboptimalClicked =() {
   		setMetric('suboptimal')
   	};


   	function setMetric(metric){
   		//Update the fill color style option based on the metric.
   		polygonLayer.setOptions({ fillColor: styles[metric] });
   	}

   	function joinMetrics() {
   	  dataSource.getShapes().forEach(state => {
   			//Cross reference the state shapes with the metrics using the states NAME property.
   			//Join the metrics with the state shapes properties.
   			var props = state.getProperties();
   			Object.assign(props, metrics[props.NAME]);
   			state.setProperties(props);
   		});
   	}

     return (
       <div>
       <div
         id={`map-${subscriptionKey}-canvas`}

         data-testid={`map`}
         style={{
           minHeight: '100%',
           minWidth: '100%',
           position: 'relative',
           ...containerStyle,
         }}
       >
         {children && children(map)}
       </div>
         <div>
         <button onclick={this.costClicked}>Cost per Shipment</button>
           <button onclick={this.orderSizeClicked}>Shipments per order</button>
           <button onclick={this.suboptimalClicked}>Sub-optimal Shipments</button>
         </div>

       </div>

     );
Also, I would not put the subscriptionKey in the ID, that just creates added security risk. A random number or GUID would be safer.