SQL Management Pack : Blocking Session Alert does not show query in alert context

Amanpreet Singh Bansal 1 Reputation point
2022-07-26T05:44:59.36+00:00

We have latest SQL Management Pack , and SCOM version is 2012 R2 UR14, which we are migrating SCOM 2019. The blocking session alerts show the query in property value but it does not show this is alert context. Please refer the screen shots. Looks like a bug or known issue, any help will be highly appreciated or helpful

224745-image.png

224655-image.png

System Center Operations Manager
A family of System Center products that provide infrastructure monitoring, help ensure the predictable performance and availability of vital applications, and offer comprehensive monitoring for datacenters and cloud, both private and public.
1,603 questions
{count} votes

2 answers

Sort by: Most helpful
  1. Graham 176 Reputation points
    2022-07-30T16:34:20.557+00:00

    Hi

    I can't test on SCOM 2012 but I've quickly created a test database and configured a blocking scenario. Using SCOM 2022 and the SQL version agnostic management pack - Microsoft SQL Server on Windows (Monitoring) version 7.0.38.0 - I can see the full alert context. The SQL Server is SQL 2019. 226451-scomalertcontext.png

    The version of SCOM shouldn't make a difference and if you are using the SQL version agnostic management packs then that is also unlikely that a different version of SQL is the cause so does this happen on all of your SQL Server instances? Or just specific ones? I don't know if it is a bug in a particular MP \ whether you have ended up with a character in the CDATA tags that has caused an issue with the formating.

    Regards

    Graham

    0 comments No comments

  2. Graham 176 Reputation points
    2022-07-30T17:11:15.117+00:00

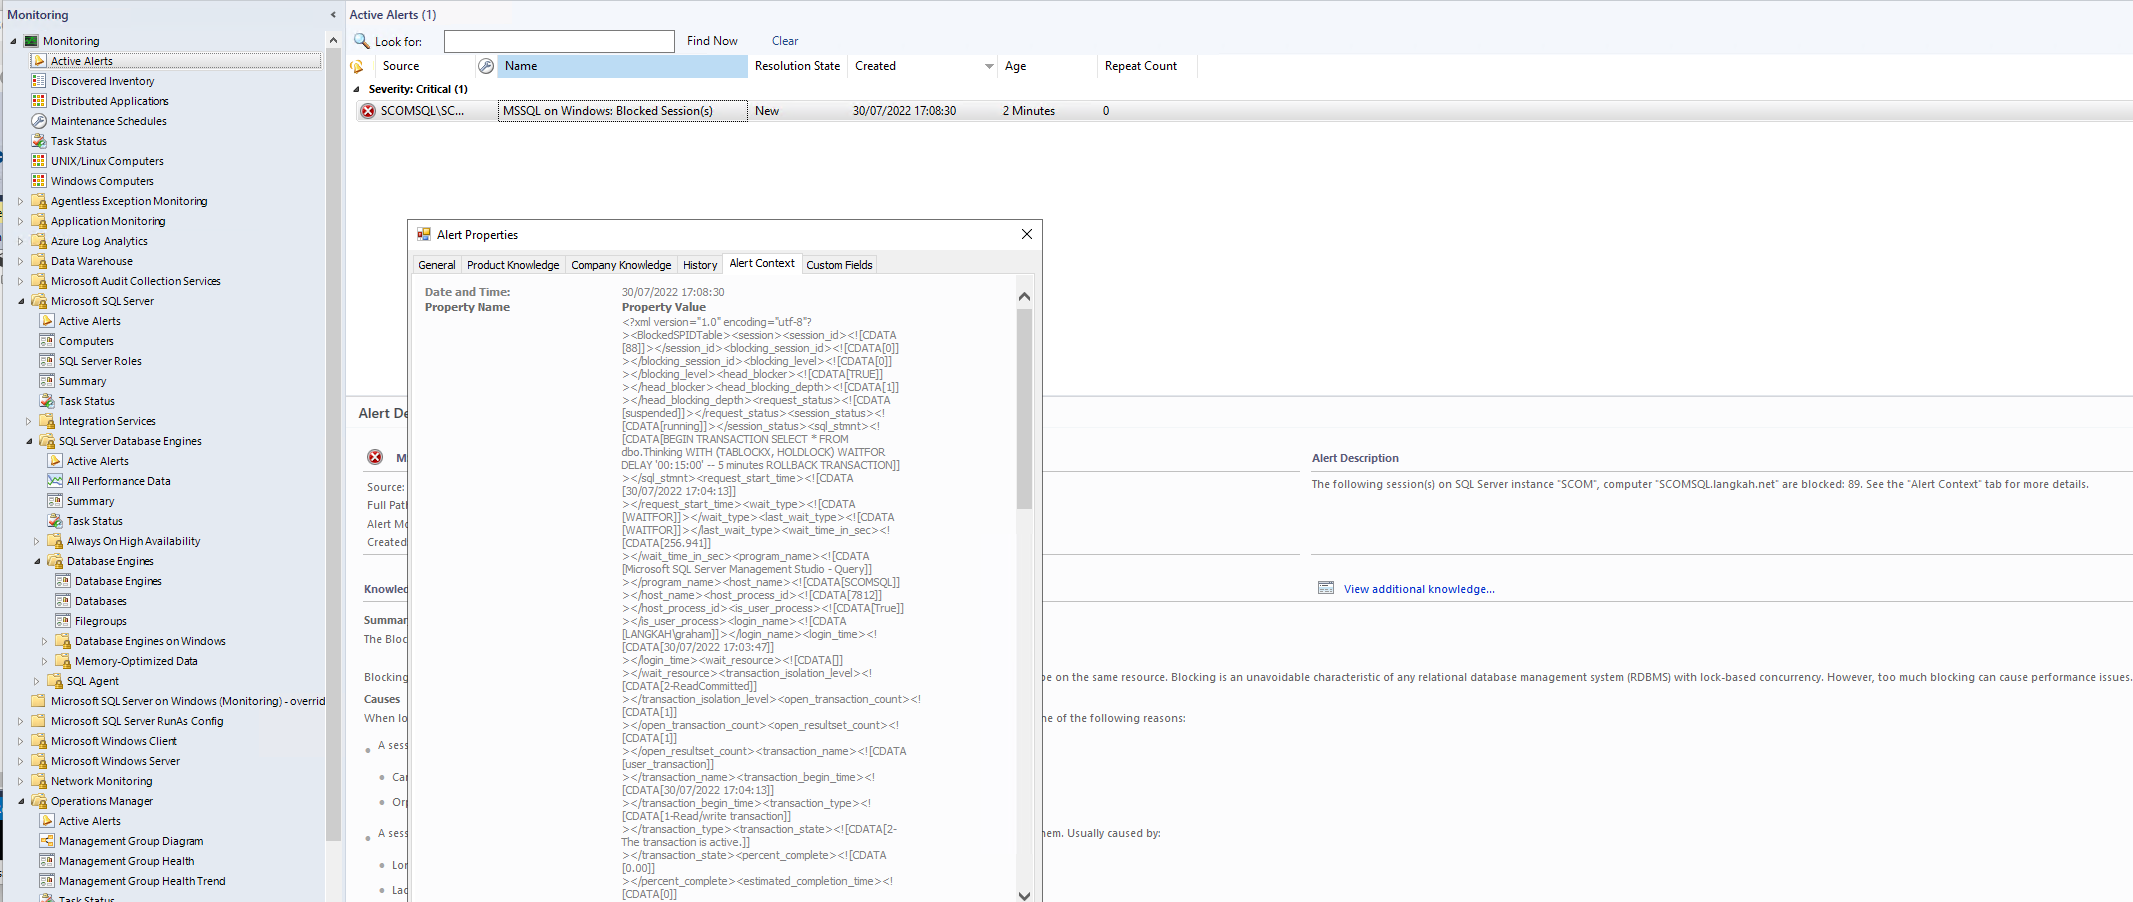
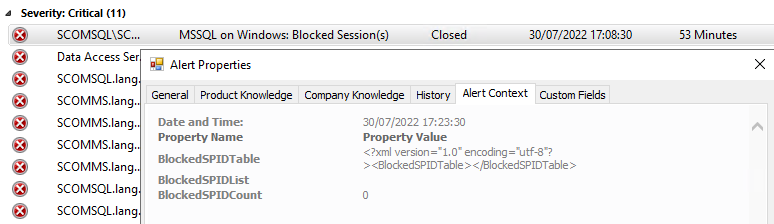
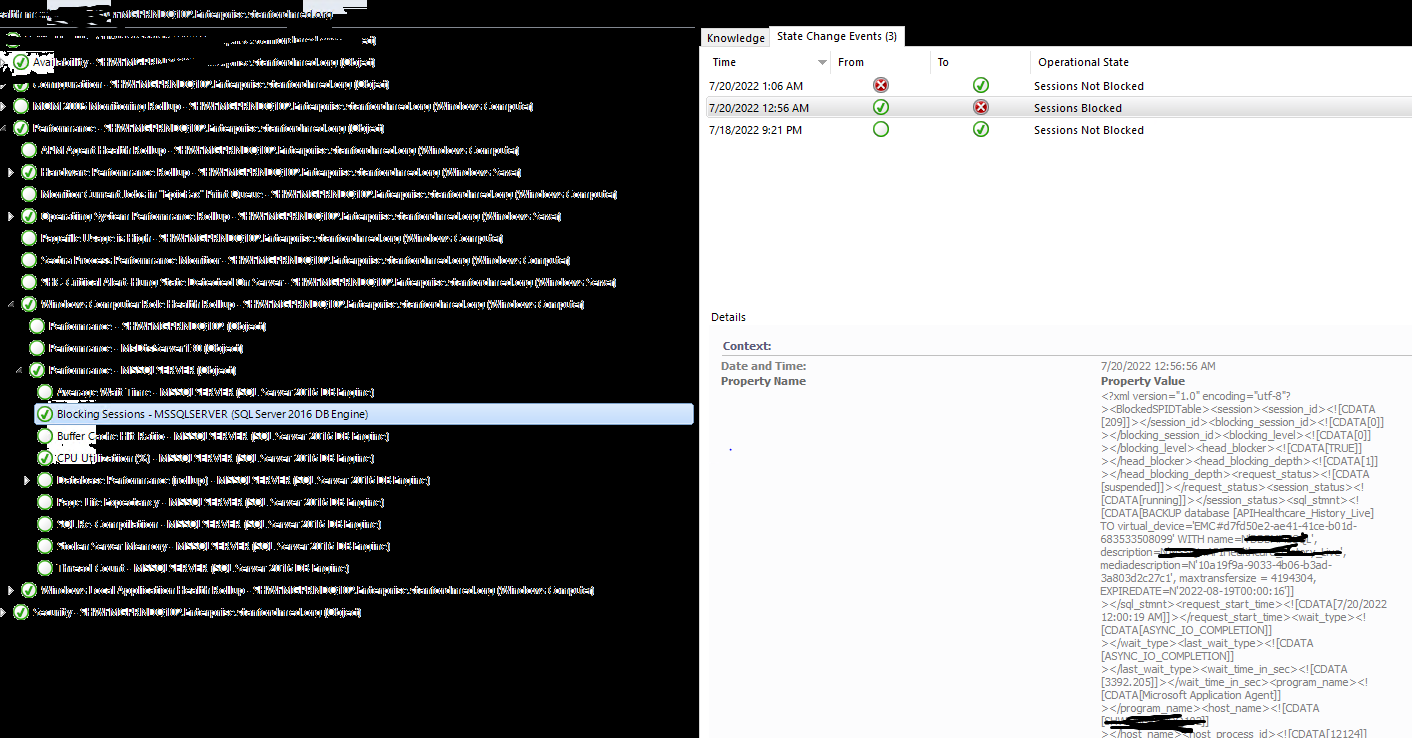
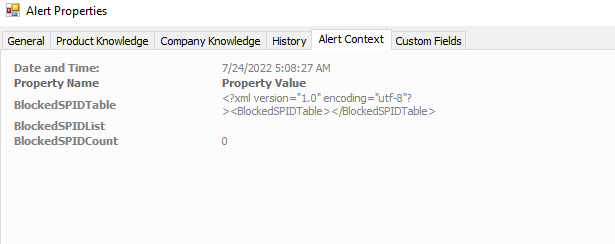
    I may just have figured it out .... once the alert is closed; the alert context is updated ... and as there is no blocking, all the details are overwritten in the console with the latest information. In your orginal screenshot; if you look at the healthy state in health explorer then the details there are likely what are being displayed in the alert context for the alert (you'll notice it states blocked spid count = 0.

    The best option is to ensure that the team look at the Health Explorer unhealthy status to see what the problem is. The original details are also overwritten in the Alert table in the OperationsManager database but they can be found in the AlertHistory table or it might be worth seeing if you can set up a notification to email out the details so that if the alert has cleared before someone looks at it then at least they knew what the issue actually was (without resorting to health explorer).

    226442-alertclosedcontextupdated.png

    0 comments No comments

Your answer

Answers can be marked as Accepted Answers by the question author, which helps users to know the answer solved the author's problem.