Azure Monitor
An Azure service that is used to collect, analyze, and act on telemetry data from Azure and on-premises environments.
3,658 questions
This browser is no longer supported.
Upgrade to Microsoft Edge to take advantage of the latest features, security updates, and technical support.
' cx='32' cy='32' r='32' /%3E%3Ctext x='50%25' y='55%25' dominant-baseline='middle' text-anchor='middle' fill='%23FFF' %3ECP%3C/text%3E%3C/svg%3E)
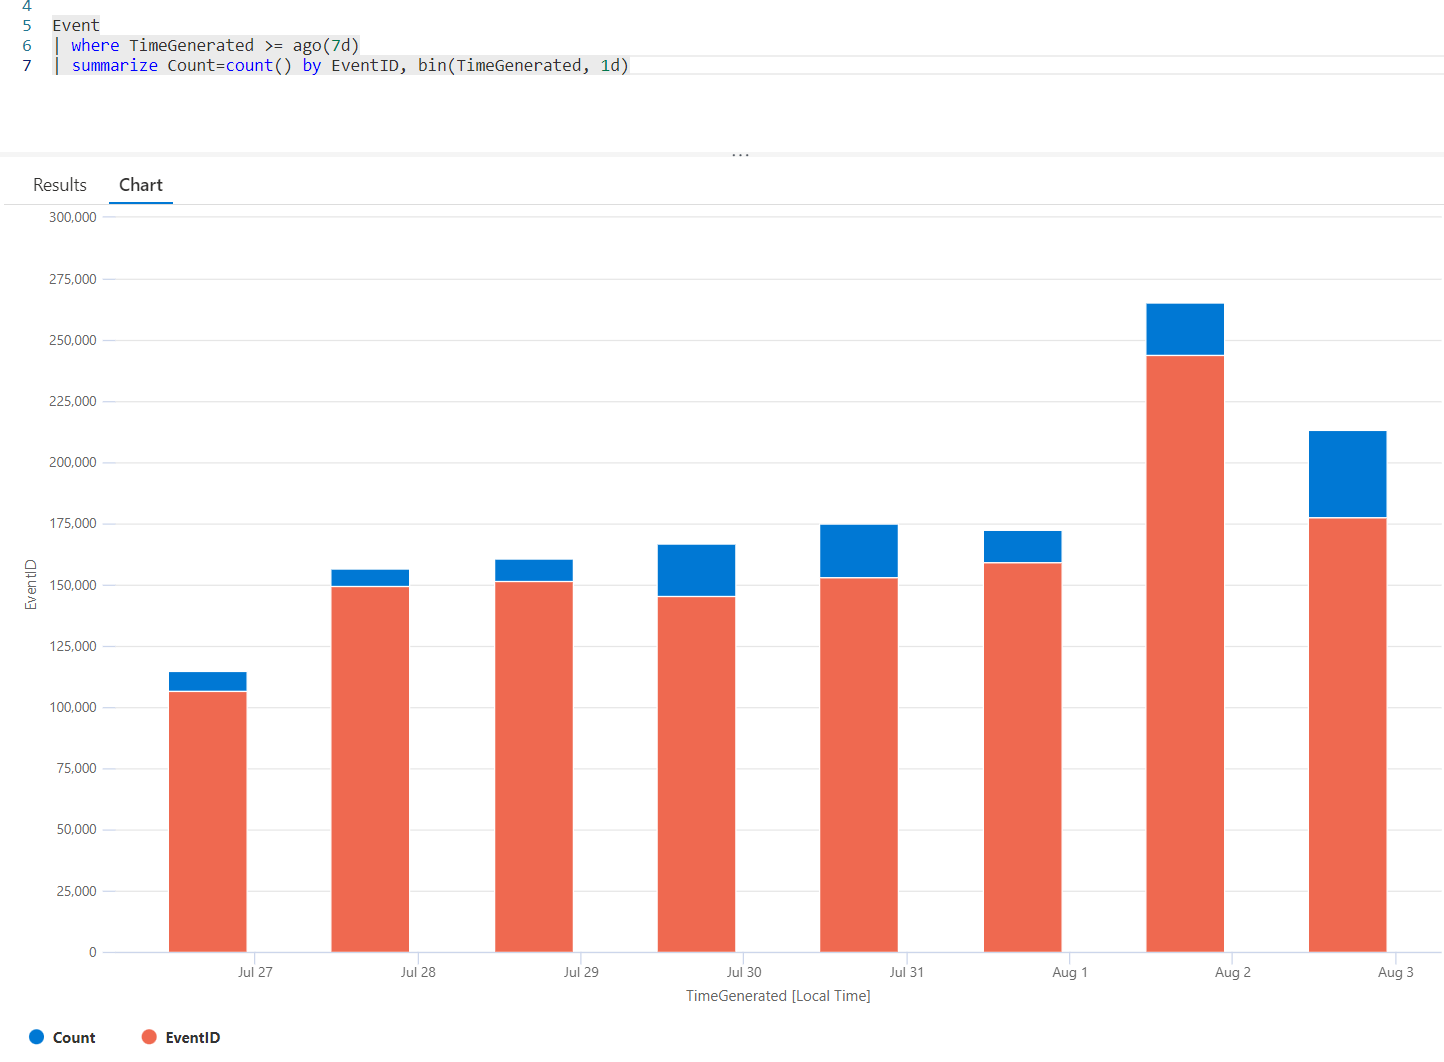
I can get the result I'm looking for when it's in table form but looks very wrong when I switch to the Chart view. Rather than trying to explain things here, I'll share a screenshot. I'm expecting to see how many of each Event ID occurred per day. What I'm seeing is very different.
p.s. The tag below is not relevant because there's no tag that is appropriate.

You need to use totring()
Event
| where TimeGenerated >= ago(7d)
| summarize count() by bin (TimeGenerated, 1d), tostring(EventID)
| render columnchart
I like yours a little better than my own that I found.
The answer is the following:
SecurityEvent
| project TimeGenerated, EventID=tostring(EventID)
| where TimeGenerated >= ago(7d)
| summarize Count=count() by EventID, bin(TimeGenerated, 6h)