I am attempting to recreate this table in PowerBI and cannot get the table to calculate data based on the bin grouping of a month.
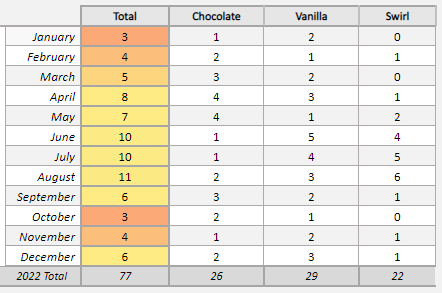
I have the following constructed:
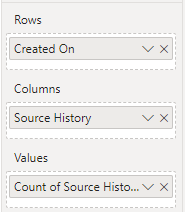
Row = Created On (where the error occurs) attempted to be New Group > Bin Size = 1 month
Columns = Source History (Chocolate, Vanilla, Swirl)
Value = Count of source history
It will tell me that date is not allowed as part of calculated column DAX expressions on DirectQuery models. I need to keep this data as a DirectQuery and cannot use the import option. I am curious if anyone has any recommendations on how to recreate this excel table inside of PowerBI. Followed along several different help articles but no luck. Thank you in advance to anyone who is able to make some recommendations.
' cx='32' cy='32' r='32' /%3E%3Ctext x='50%25' y='55%25' dominant-baseline='middle' text-anchor='middle' fill='%23FFF' %3EDH%3C/text%3E%3C/svg%3E)
