windows Performance monitor's data in the report is incorrect

Panda_mkk 1 Reputation point
2022-09-02T01:57:56.537+00:00

My system is Windows Server 2019
As shown in the figure, the maximum value is 7.871
7.871 * 10 = 78.71

However, the largest part in the line graph is less than 60

What's the matter? Why are the images different from the displayed data
And this phenomenon only occurs when the monitoring time is long (about 1 hour or more)
At 10 minutes, the data and graph are the same

237104-image.png

And I also want to ask,How is the value of disk time calculated

237008-image.png

19175.626 * 0.01 = 191.75626 Is my calculation correct?
The maximum seems to exceed 100

Windows Server 2019
Windows Server 2019
A Microsoft server operating system that supports enterprise-level management updated to data storage.
3,448 questions
0 comments No comments
{count} votes

2 answers

Sort by: Most helpful
  1. JimmySalian-2011 41,916 Reputation points
    2022-09-02T05:37:54.923+00:00

    Hi Pandam,

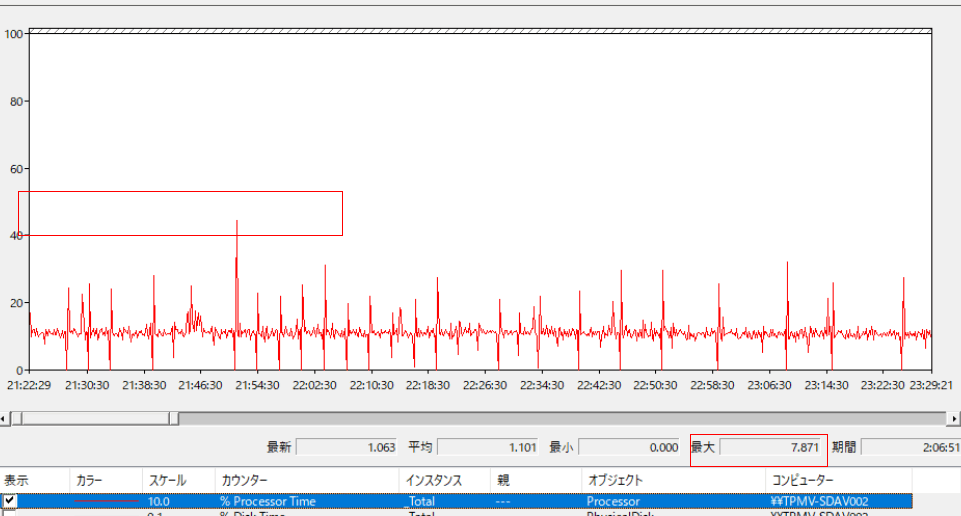
    The %processor time if I can see from the screenshot it is scale set at 10, any reason you have set it to 10 instead of default 0.1? As this counter is the primary indicator of processor activity, and displays the average percentage of busy time observed during the sample interval. It should be noted that the accounting calculation of whether the processor is idle is performed at an internal sampling interval of the system clock (10ms)

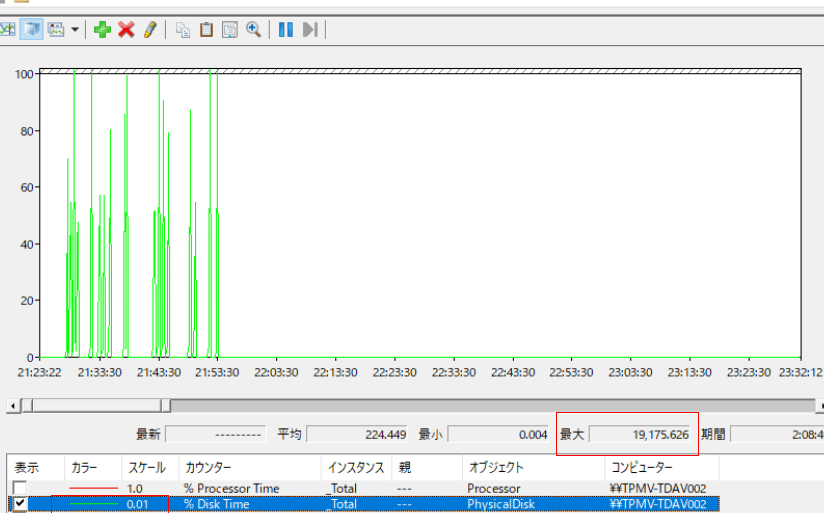
    % Disk Time again you are calculating against the scale this is incorrect, this is a measure of the percentage of time that the disk was idle. ie. there are no pending disk requests from the operating system waiting to be completed. Ideally you would want this value to be as high as possible but even low values are acceptable

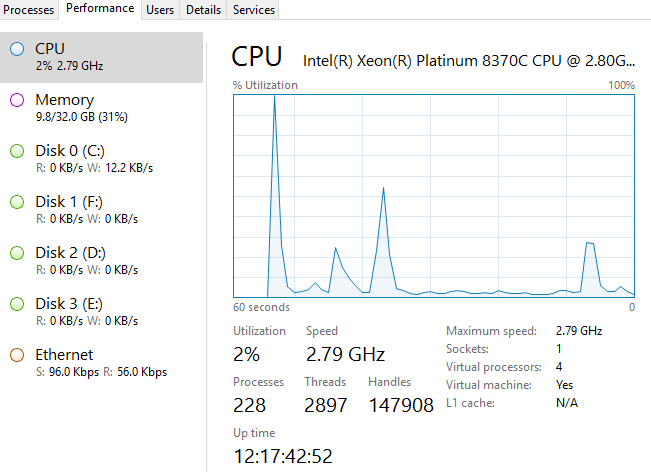
    Best approach will be to monitor the Task manager resourceMonitor for advance and easy view. Also review this article for understanding of this PerfMon. bb734903(v=technet.10)

    237097-image.png

    ==
    Please "Accept the answer" if the information helped you. This will help us and others in the community as well.

    0 comments No comments

  2. Limitless Technology 39,341 Reputation points
    2022-09-05T07:30:29.97+00:00

    Hello there,

    Disk active time is the time the HDD is working. The higher the time/percentage, the more you utilize the HDD.
    If you hit 99%, you are actually bottle-necked by the read/write performance of your HDD.

    % Disk Time is the percentage of elapsed time that the selected disk drive was busy servicing read or write requests.

    Basically, it is the percentage of elapsed time that the physical drive(s) were busy. So Even though your MB/s usage may be low, the % busy time can be high if the disk is heavily fragmented, or is otherwise thrashing on lots of small operations.

    On a server where you would try to match the right level of high-performing disks to the workload, you would consider the disk subsystem to be a potential bottleneck if the % active (busy) time plateau-ed above 80%. On a workstation if this number is high, it just tells you that your disk performance is maybe what is slowing down your work.

    I hope this information helps. If you have any questions please let me know and I will be glad to help you out.

    --------------------------------------------------------------------------------------------------------------------------------

    --If the reply is helpful, please Upvote and Accept it as an answer--

    0 comments No comments