Microsoft 365 and Office | Excel | For business | Windows
A family of Microsoft spreadsheet software with tools for analyzing, charting, and communicating data
This browser is no longer supported.
Upgrade to Microsoft Edge to take advantage of the latest features, security updates, and technical support.
' cx='32' cy='32' r='32' /%3E%3Ctext x='50%25' y='55%25' dominant-baseline='middle' text-anchor='middle' fill='%23FFF' %3ECD%3C/text%3E%3C/svg%3E)
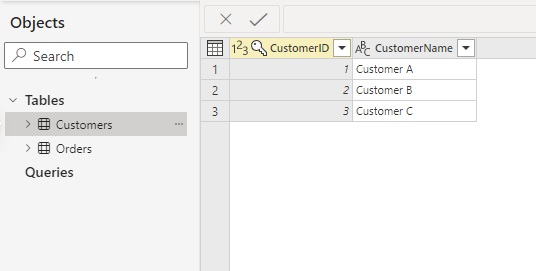
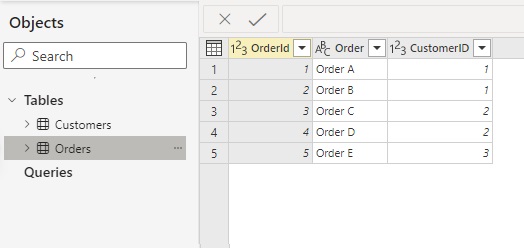
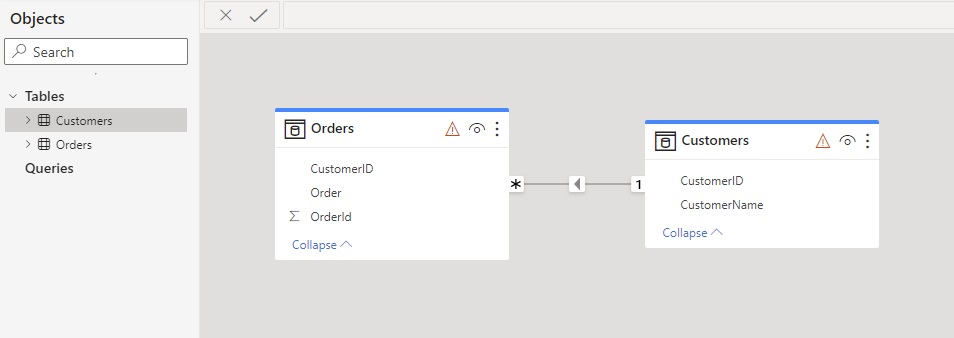
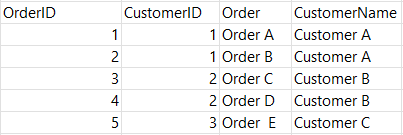
A Pivot table against a data connection (Get data) to PowerBI Datamart (Dataset) or Azure Analysis Services database doesn't seem to use or see the table relationships for query or filter contexts. For example, say you have a simple model (stored in PowerBI) where you have Products, Customers, and Orders tables. These tables have 1-to-many relationships (One Customer -> many orders, One Customer -> many Products). If you connect with PowerBI desktop and put a table visual showing all orders, and add a slicer that lists Customers, you can subsequently limit the data in the order visual by selecting a specific customer in the slicer (as expected). When creating a Pivot table in Excel against the same dataset, adding the order fields you'd like to see in the rows (fields list), and then subsequently creating a slicer for all customers, you won't get any data filtering affect in the Pivot table. It's hard to tell what can/should be done to make this work the same as PowerBI Desktop?? Anyone have insight into what's expected, or can be done to make this work properly?
Example:
I expected in the last step below for it to react like PowerBI Desktop (slicer limiting customers).. However PowerPivot seems to ignore the relationship between Customers and Orders??
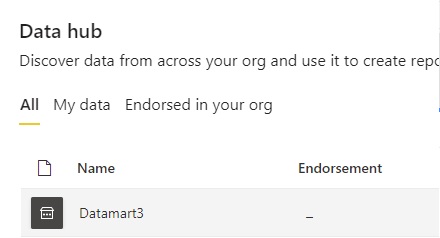
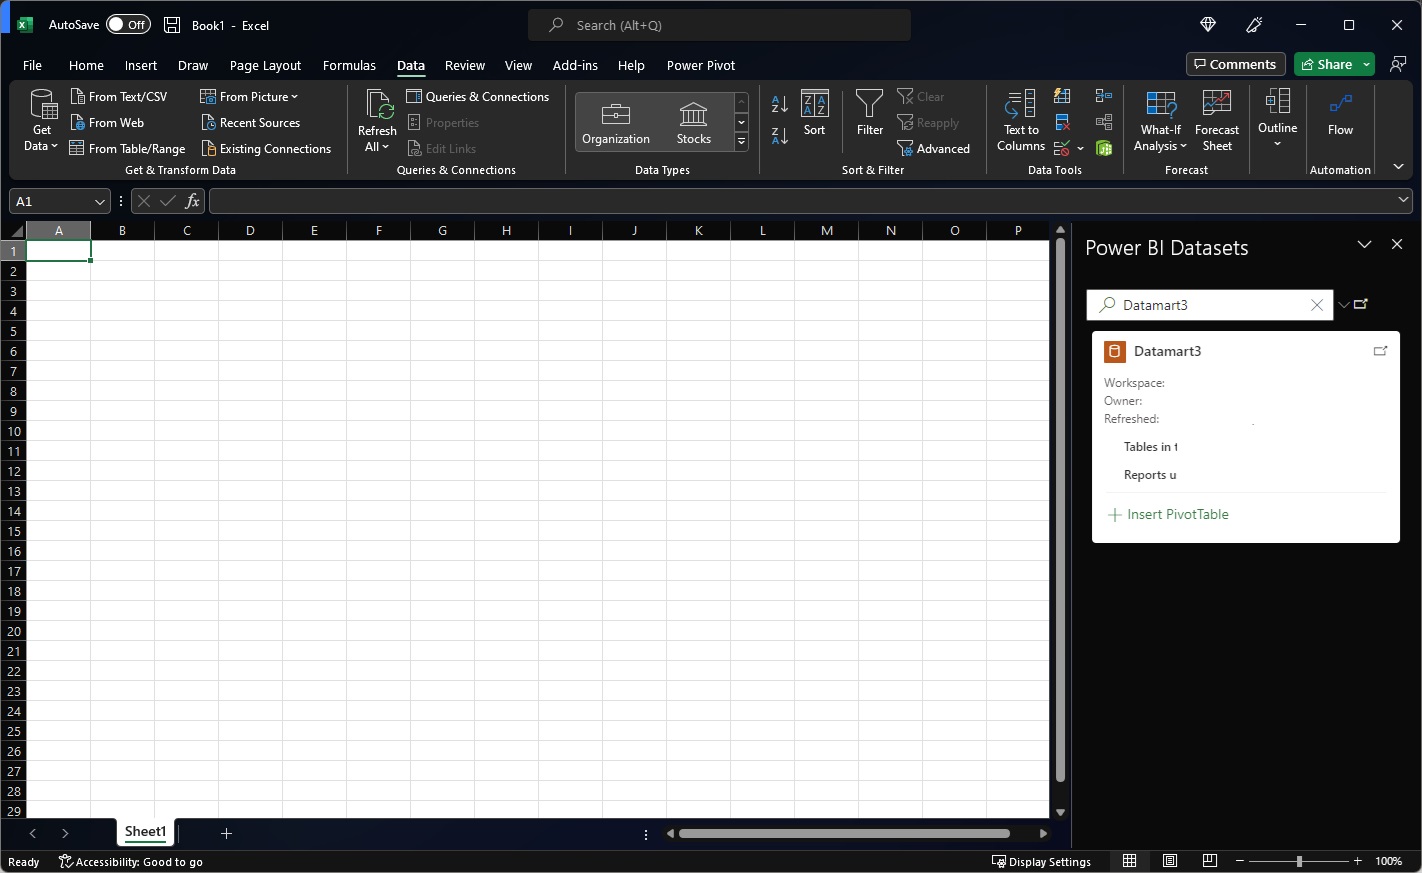
Connect from PowerBI:
Add DataTable, Add Slicer:
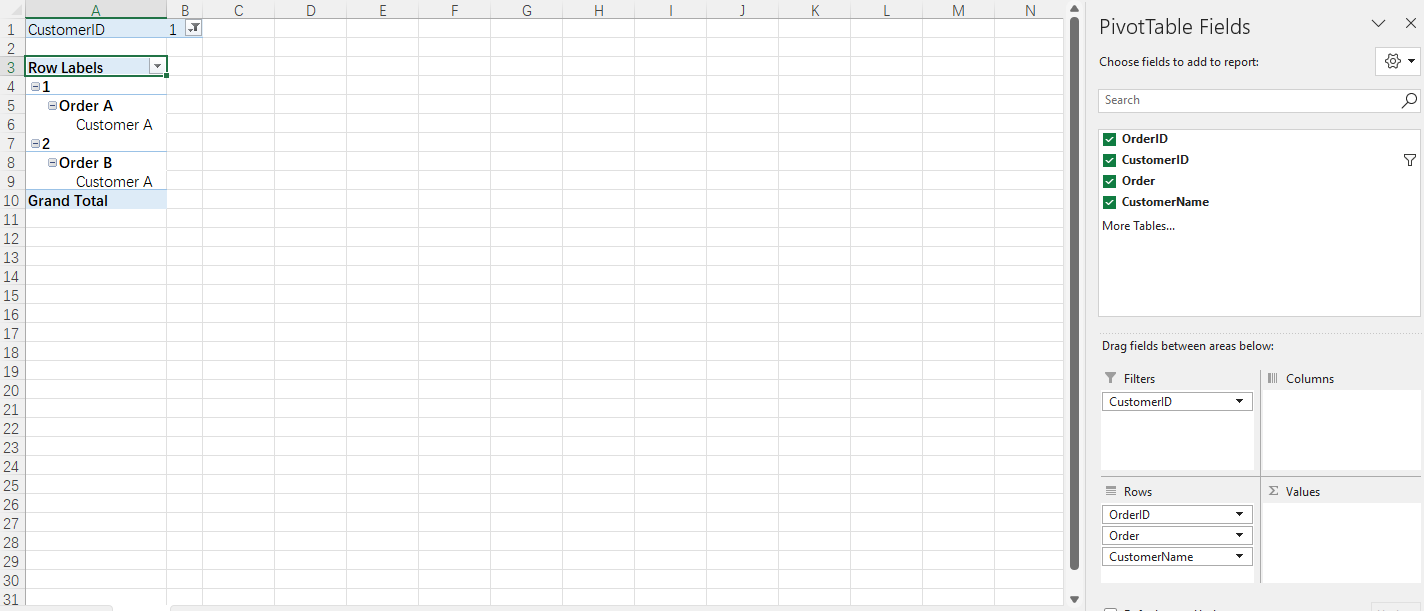
Select customer in slicer to limit orders listed:
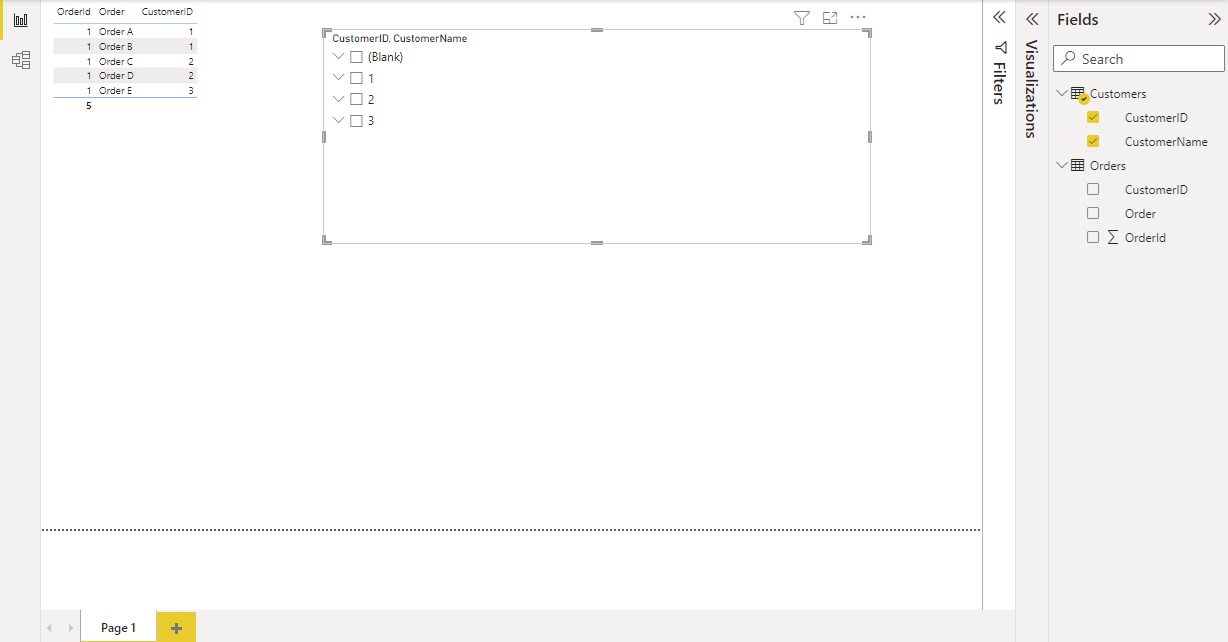
No Slicer (Customer Selected)
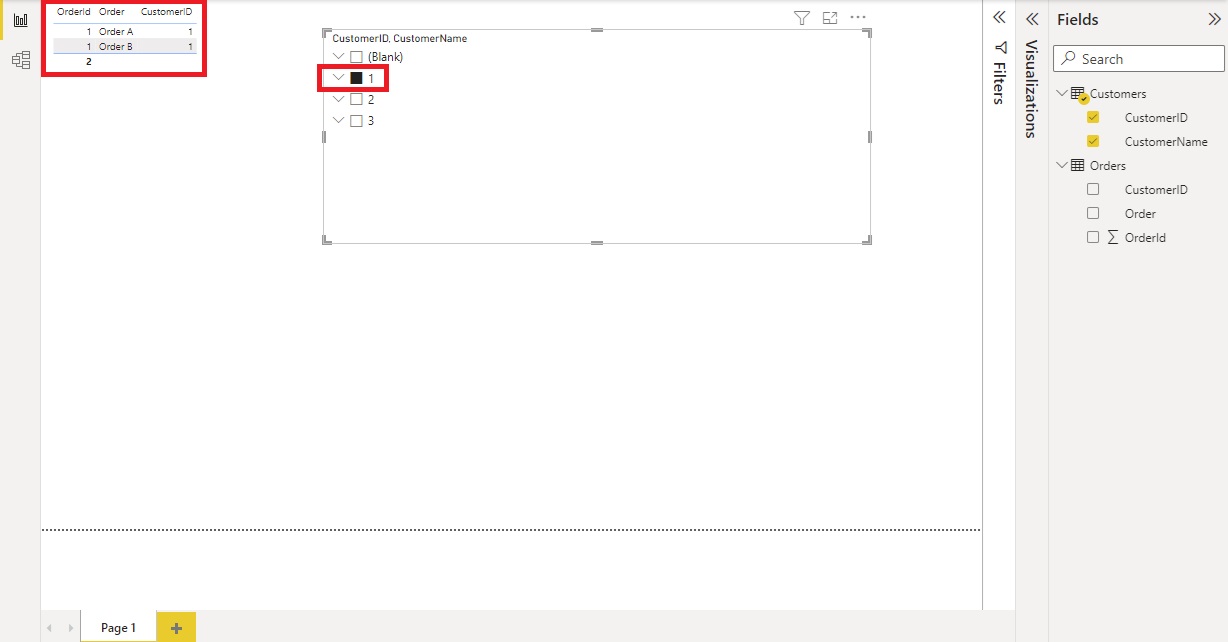
With Slicer Limiting Customers (only Orders from CustomerID 1 are shown in table)
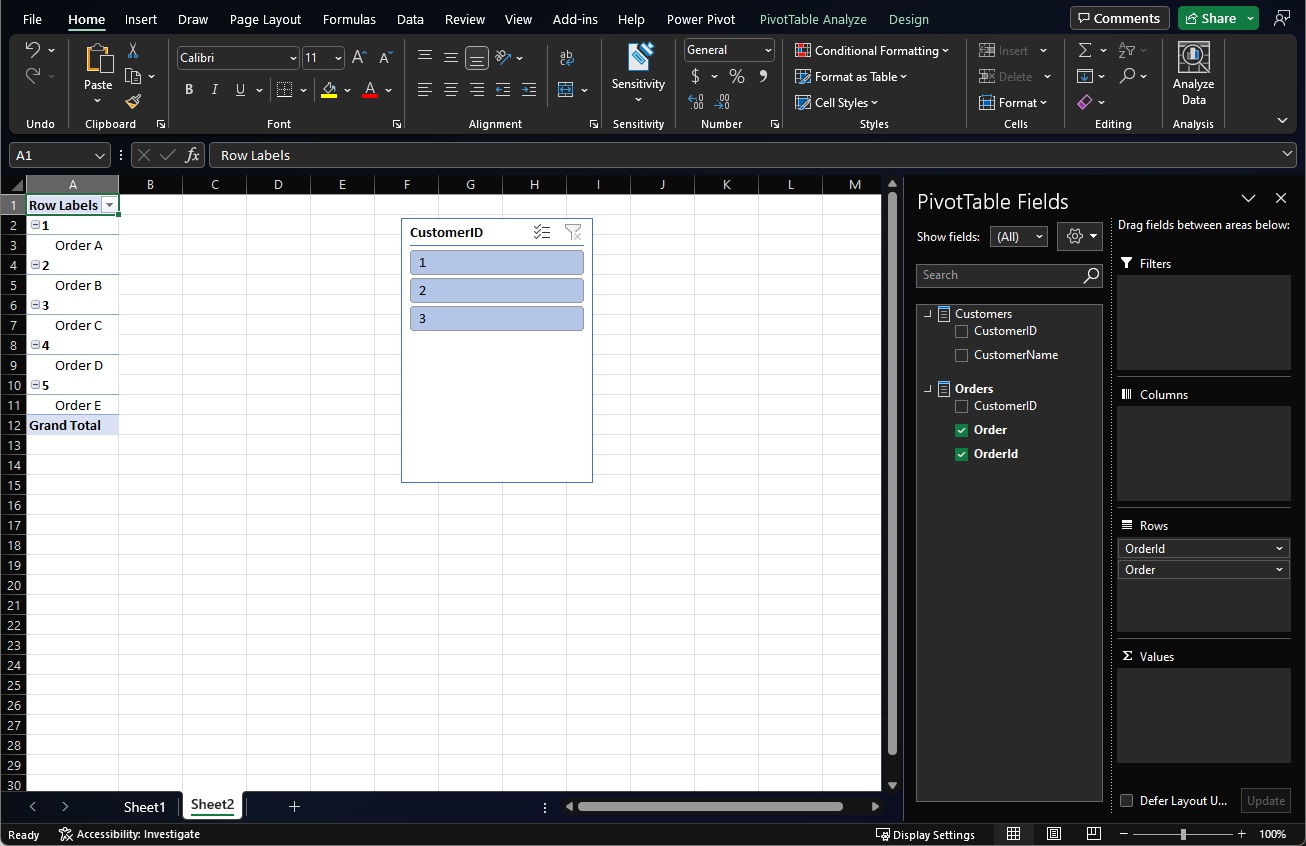
Excel PowerPivot:
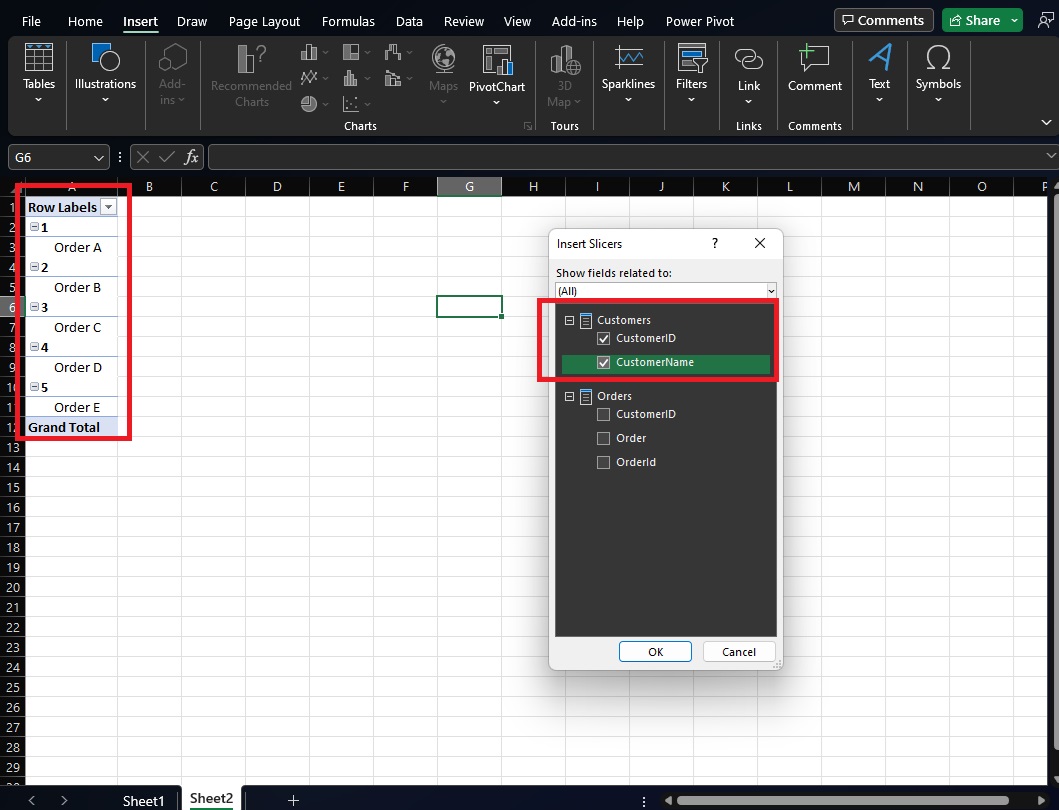
PowerPivot and Slicer added:
No Slicer Value selected:
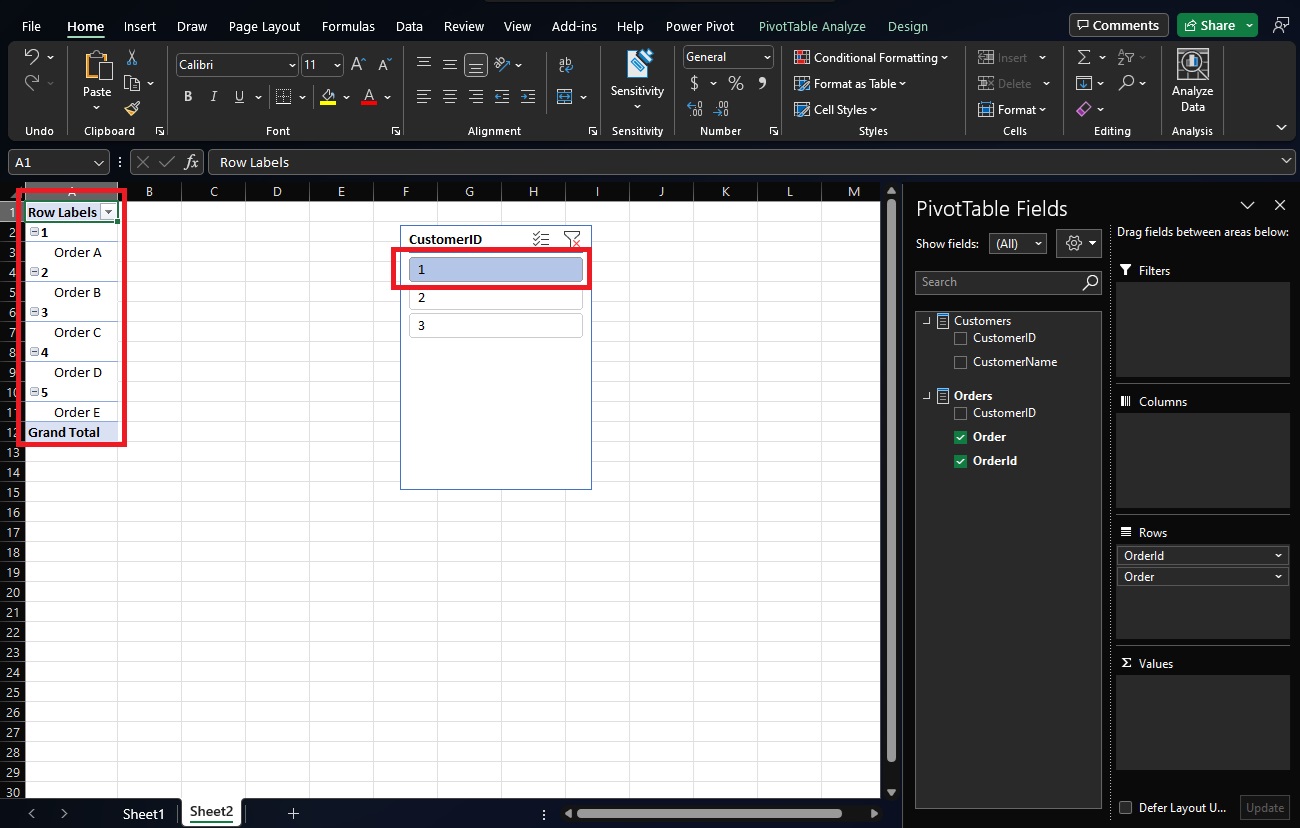
Slicer Value selected (no impact on pivot table, all order values still listed):
' cx='32' cy='32' r='32' /%3E%3Ctext x='50%25' y='55%25' dominant-baseline='middle' text-anchor='middle' fill='%23FFF' %3ECQ%3C/text%3E%3C/svg%3E)
Hi, @Craig Darling
You can join these two tables using VLOOKUP function and create a pivot table.
If the response is helpful, please click "Accept Answer" and upvote it.
Note: Please follow the steps in email-notifications to enable e-mail notifications if you want to receive the related email notification for this thread.
Hi @Charles Qi_MSFT ,
VLOOKUP makes sense to use when all of the data is pulled into Excel and the join is done as a preparation step (where I basically hardcode the relationship between this data by combining it). I'm most interested in understanding how/if Excel handles joins (or rather does it even interpret the model relationships) when connecting to a cube in AAS or a dataset in PowerBI, like my example explains. "However PowerPivot seems to ignore the relationship between Customers and Orders??"
Hi, @Craig Darling
According to the official document, when you import related tables from a relational database, Excel can often create those relationships in the Data Model it's building behind the scenes. For all other cases, you'll need to create relationships manually.
Hi, @Craig Darling
Just checking in to see if the information is helpful. Please let us know if you need further assistance.
If the response is helpful, please click "Accept Answer" and upvote it.
Note: Please follow the steps in email-notifications to enable e-mail notifications if you want to receive the related email notification for this thread.
Hi, @Craig Darling
Is your doubts been solved?
Hi CharlesQi-MSFT,
Unfortunately, my original question remains unanswered. It does appear that Excel simply does not honor source database relationships (it shouldn't have to create anything) and instead interprets them upon function execution (or if the relationships are defined in excel manually and the data imported into the spreadsheets). For example, for the above scenario to work I would have to create a measure in the data source (PowerBI or Azure Analysis Services) and use that measure in the values area of the pivot table.. Then all of a sudden the pivoting (slicers and filters) begin working, but still no relationships have been imported or can be observed.
I guess I expected Excel to be aware of the relationships by default (and primary/foreign keys). It is not.
Appreciate the earlier response! For those following this thread, simply place a measure (any measure) in the source model and put it in the values column. Taadaa!
I am very glad that you find the solution. Thank you for sharing!