Note
Access to this page requires authorization. You can try signing in or changing directories.
Access to this page requires authorization. You can try changing directories.
Important
Visual Studio App Center was retired on March 31, 2025, except for the Analytics and Diagnostics features, which will continue to be supported until June 30, 2026. Learn more.
General
App Center’s Diagnostics service is designed for you to easily monitor your apps' health and get the information you need to fix issues.
- Login to the App Center Portal
- Select an application
- In the navigation area on the left, select Diagnostics
App Center displays the crashes and errors in one view under the Issues tab. You can filter these issues by crashes or errors by clicking the respective tabs.
For all apps, you can filter the diagnostics data by app version, build number, time range and status. Click on a group to find more information including a list of specific reports, devices and OS versions affected.
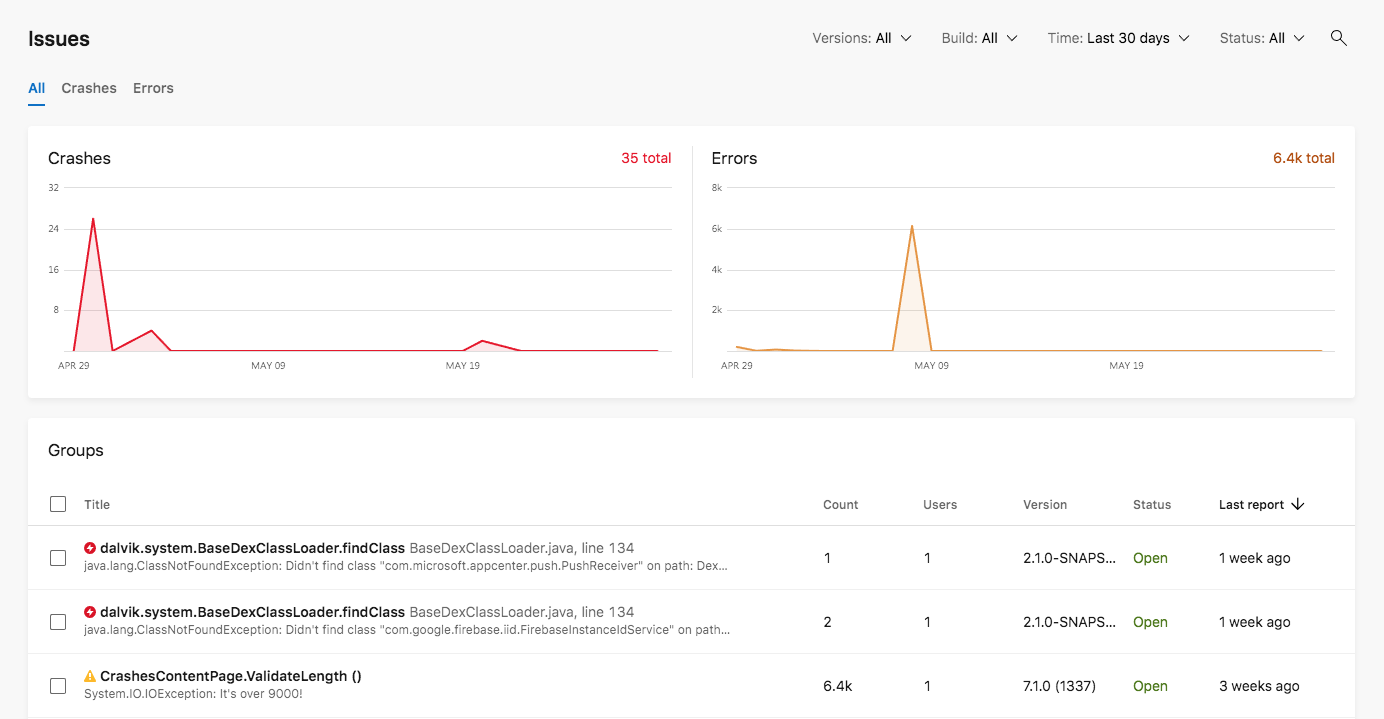
Note
When filtering crashes or errors in groups list, the total count and affected user count values will always reflect the total number of crashes for the respective group. They aren't affected by Time filters.
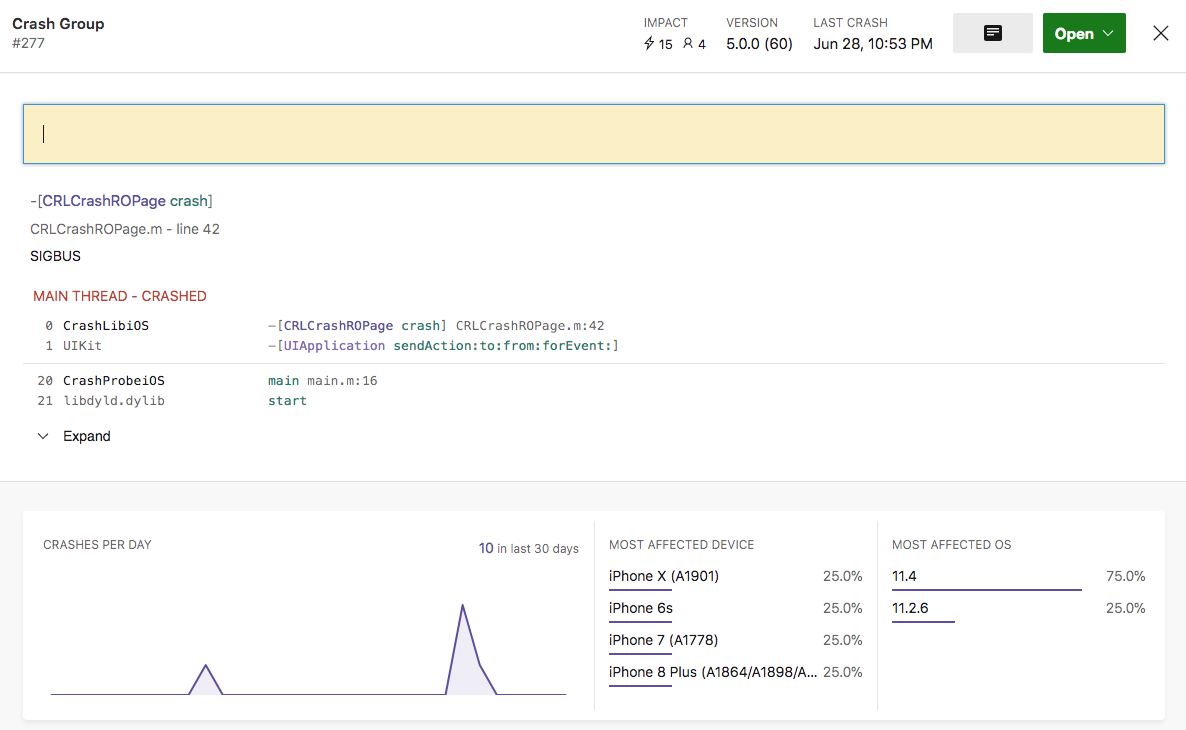
Annotate a group
Annotate your groups in App Center diagnostics to keep track of notes and other important information. To leave an annotation:
- Select the Diagnostics service
- Select a crash or an error group
- In the upper right-hand corner, click the annotate button
- Leave a text in the text box and your note will be automatically saved
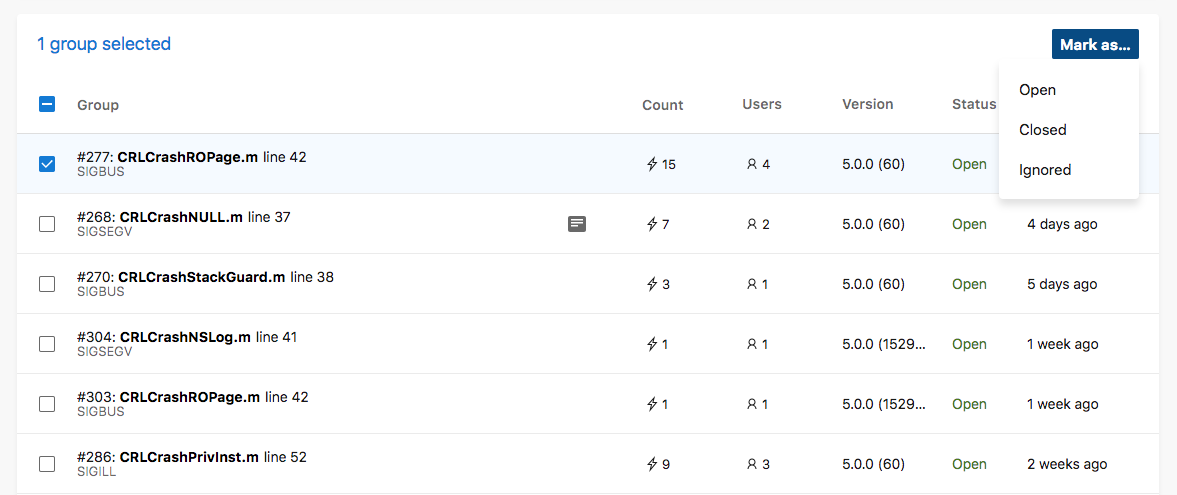
Track the status of your groups
Mark each of your groups as open, closed, or ignored. To mark the status of your groups:
- Select a group or select multiple groups
- Click on the Mark as button
- Select the state (open, closed, ignored)
Any new crash or error instance which is part of a closed or ignored group won't reopen or unignore the corresponding group.
Use the Filter option in the upper-right corner of the page to filter crashes/errors by open, closed, and ignored, focusing your view on the data that matters.
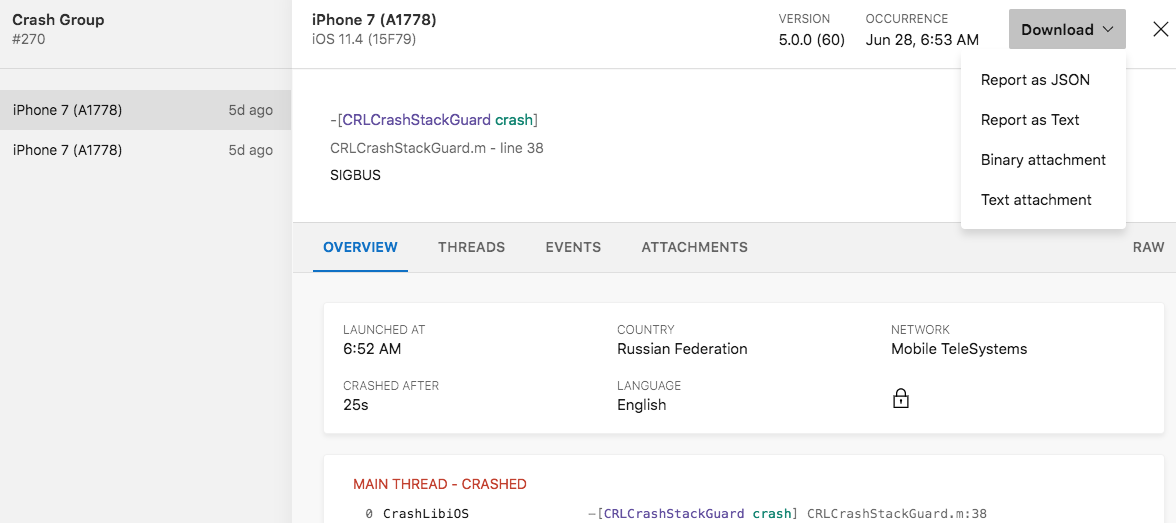
Download Diagnostics Data
You can download your diagnostics data to access raw data for further analysis. To download your diagnostics data:
- Navigate to the Diagnostics section
- Select Crashes or Errors
- Select on a specific group
- Select a specific report
- In the upper right-hand corner, click on the Download button and select a format (JSON or Text)