PerfMon - Where are the process counters?
Almost everybody knows how to use Windows Performance Monitor, or just PerfMon, but there are some tips & tricks that many people don't know and they should know, because can have a negative impact in your data collection and analysis.
One of them is how to save the output file: Binary (BLG) or Comma Separated (CSV) ?
There are pros & cons for both of them, but if you use CSV format, be aware that you can miss important counters during the data collection.
Scenario:
High CPU usage during a period of time.
Cause:
A process started and consumed more CPU than expected.
Goal:
Identify which process was running and caused the high CPU usage.
So, you can use Perfmon to collect \\Process(*)\%Processor Time, this way you can identify which process was consuming the most of the CPU in a specific period.
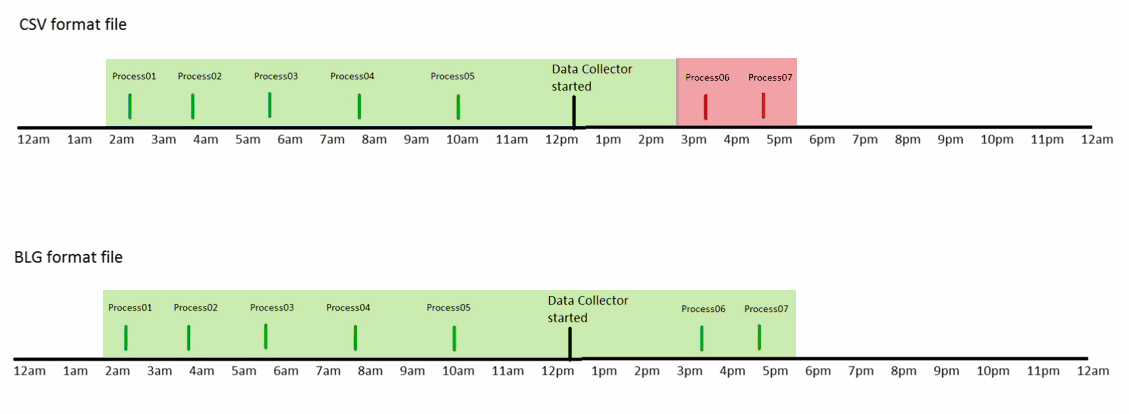
If you use CSV format to save the output, all of the processes started after the data collection start time WILL NOT be included into the CSV file.
You can see in the image below that PROCESS06 and PROCESS07 were not included in the output file, and will not be detected during your analysis.
In the link below (YOUTUBE VIDEO), I'm showing you more details and a demonstration:
Take care...
Alex Rosa