Note
Access to this page requires authorization. You can try signing in or changing directories.
Access to this page requires authorization. You can try changing directories.
The last time I posted, I pointed out the significant increase in pageviews for project management as a share of pageviews for all the content we have for Visual Studio ALM (fka VSTS). I know that pageviews for TF administration content are down, and that's at least in part due to the new administration console for Team Foundation, and they way it services F1 requests. First, if you're using the admin console for TF in Dev 10, then you are probably using a UI to do something that you had to do with command line tools in VS 2005 & VS 2008. If you needed help beyond what the command line tool gave you with /?, you probably searched online and, hopefully, found the topics you needed on MSDN. Now, when you're in the administration console, you have the option of hitting F1 instead of searching manually online for the information you need. If you do that, you'll be directed to a local chm file instead of the online help files (even if you have online help configured). I think that's probably the primary reason the page counts for administration content has dropped off.
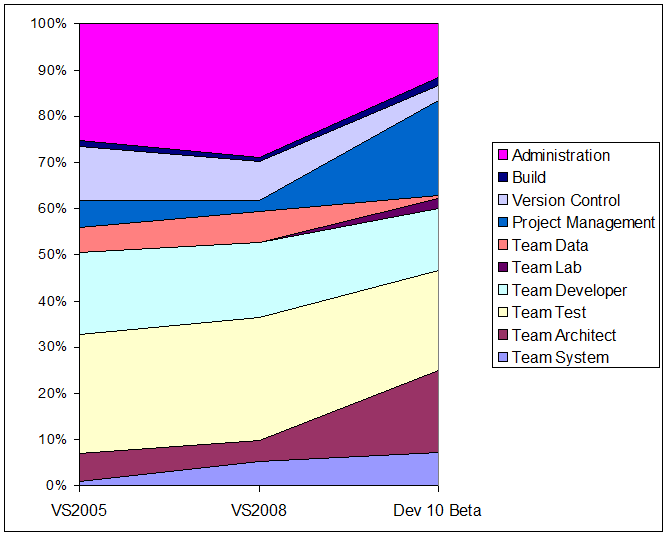
So, I wondered whether that drop in counted pageviews for the admin topics was contributing significantly to the apparent increase in project management topics. I decided to look at the pageviews for project management as a share of VS ALM both with TF administration and without it to see. I also broke out the other areas of VS ALM (like testing) for comparison. Here's the first chart, which includes TF administration. The big changes for Dev 10 are a drop in TF administration, and significant increases for both project management and architecture. (I hadn't noticed the increase for architecture before).
So, how does it look if administration page views aren't included? Pretty much the same for project management. Project management's increase in share pageviews isn't really impacted by taking TF administration out of the mix.
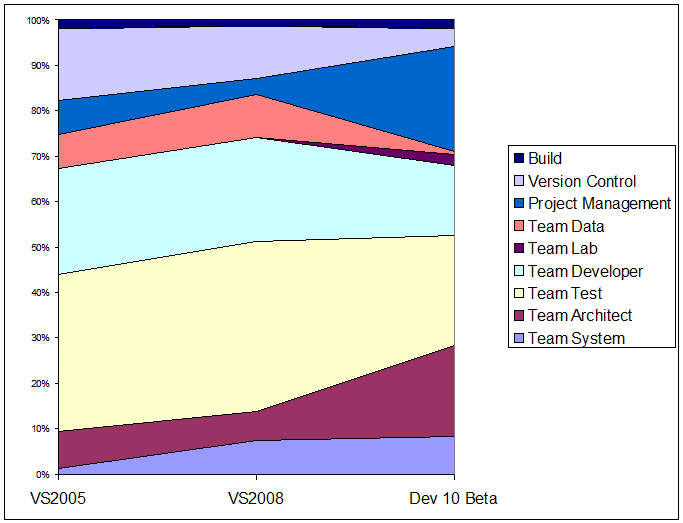
I noticed a few other things in the chart that are interesting, or at least worth explaining.
- As I mentioned above, architecture has seen a substantial increase in the share of pageviews.
- Testing, project management, and architecture each have about a 20% share of the pageviews.
- Team data dropped off to nearly nothing, but that's because it's mostly folded into developer topics.
- Combined, data & developer took a pretty sharp drop in share of pageviews, as did version control.
- Testing pageview share also dropped, but less than data and version control.
- Lab appears in Dev 10 for the first time because there was no lab product in VS 2005 & VS 2008.