Note
Access to this page requires authorization. You can try signing in or changing directories.
Access to this page requires authorization. You can try changing directories.
Hello,
There are some great blogs out there which gives a lot of in-depth information on debugging. My main aim with this blog is to give an introduction to those who are very much new to debugging. .
In this blog I will try to explain how well we can troubleshoot Worker process Crash issues due to Stack Over flow exceptions.
Setting up Windows Debugger
=========================
Go ahead and download windows Debugger from the site.
https://www.microsoft.com/whdc/devtools/debugging/default.mspx
By default it gets installed in C:\Program Files\Debugging Tools for Windows. Open Windbg à File àset the symbol file path as srv*C:\Symbols\Pub*https://msdl.microsoft.com/download/symbols.
Create a folder Symbols and a subfolder Pub under C:\, press ok and Save the work space. This folder is to store the publicly available symbols from Microsoft (https://msdl.microsoft.com/download/symbols)
Setting up Debug Diag to Capture Crash dumps
==========================================
Install the latest version of DebugDiag https://www.microsoft.com/downloads/details.aspx?FamilyID=28bd5941-c458-46f1-b24d-f60151d875a3&displaylang=en
Configure DebugDiag to capture the memory dump when the ExitProcess or TerminateProcess command is called. This will ensure that we capture the memory dump when the faulting thread is terminating the process.
1. Open DebugDiag
2. On the Rules tab, click Add Rule
3. Select Crash and click Next
4. Select "All IIS Processes" and click Next
5. Under Advanced Settings, click Breakpoints
6. Click Add Breakpoint...
7. Select KERNEL32!ExitProcess and Kernel32!TerminateProcess .Change Action Type to Full UserDump
8. Click OK
9. Click Save and Close
10. Click Next through the rest of the wizard
Now whenever the crash occurs DebugDiag will capture the dump. By default it will be under C:\Program Files\DebugDiag\Logs\Crash rule for all IIS_COM+ related processes .
Make sure that you disable all the health monitoring settings in IIS Application pool to prevent the dumps getting generated due to a normal application pool recycle.
Once you have the dump load the same in Windbg. File -->Open Crash dump.
Type in the following command in the debugger to get the symbols files for all the loaded modules from the symbol file path
.reload /f --> reloading the modules (F is for forcing reload)
Once the debugger finishes downloading the symbols, open up C:\Symbols\Pub folder and you can see the Public symbols that got downloaded. From next time onwards debugger will be getting symbols from this cached location.
In order to run the commands and look through the dumps we need the SOS.dll which comes along with .Net Framework. Copy SOS.dl from C:\WINNT\Microsoft.NET\Framework\<Respective Version>\ and put it under C:\Program Files\Debugging Tools for Windows folder.
For getting help on the commands available in SOS.dll type !help on the debugger window . You will be able to see the list of commands available. If you need further help on any command type in !help <Command Name> Eg :- !help eeheap
Now to look at the threads type in !threads.
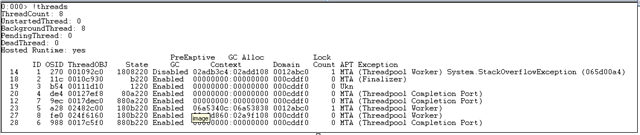
We can see that thread 14 is the one which has caused the stack over flow exception.
We are thread 0 now. To move to thread 14 type ~14s . To see the native call stack type kpn

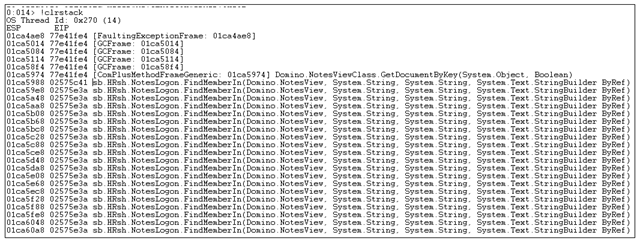
To see the Managed stack type !clrstack

We can see that a function UserLogin() is getting called recursively which us causing the stack to overflow. Now let us try getting more details on the function such as the module and assembly name from which this function gets called.
Select a Code adress (Second column) from the above stack and type in !ip2md 02575e3a
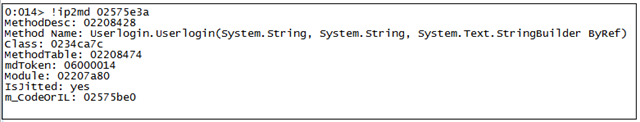
We can see the module name(02207a80), type in !dumpmodule to dump out the module information
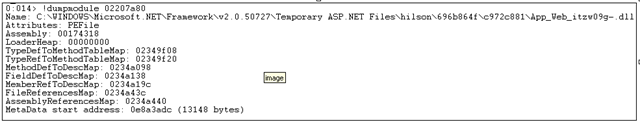
You can see that the UserLogin() function is getting called from the assembly App_Web_itzw09g-.dll
You can dump out the module information using lmvm command

Save the assembly to local disc using the command !savemodule App_Web_itzw09g_ c:\Assembly.dll and use reflector to get the function details.
Download Reflector
https://www.aisto.com/Roeder/Frontier/Default.aspx?PermaLink=53
Pass your comments to know whether this blog was helpful.....
So till next time..Bye bye...
Ref:- https://support.microsoft.com/kb/892277
Comments
- Anonymous
August 30, 2007
PingBack from http://msdnrss.thecoderblogs.com/2007/08/30/