Adding Values to Rows and Columns
The release notes for CTP3 references the ability to add values to rows and columns. But what does this really mean? Inspired by quite a few questions on this already I thought I’ll try to provide a little more details on this.
In the RTM version of PowerPivot you can add multiple measures to the values area of a PivotTable, but you are not able to add measures to rows and columns. Let me add some examples to illustrate.
Behavior in PowerPivot RTM
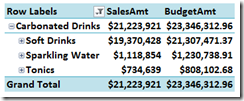
If you add multiple measures, let’s say Sales Amount and Budget Amount - to the values area of the Field List the two measures will show in the values area of the PivotTable as shown below.
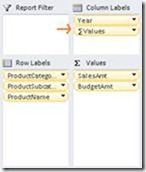
Now if you add another field, let’s say Year to the Column Labels the two measures you added previously will be nested within the newly added column field.
In my example, the Sales Amount and Budget Amount will be nested under the columns of Year 2003 and Year 2004. The measures will always show up nested under columns. This measure location cannot be changed meaning that you will not be able to reverse the order and show Year nested under Sales Amount and Budget amount. Nor will you be able to show Sales Amount and Budget Amount on rows. This is the behavior in the RTM version of PowerPivot.
New behavior in CTP3 of Denali
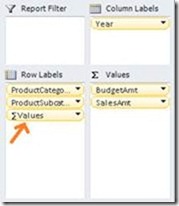
The new feature listed in the release notes for CTP3 as the ability to add values to rows and columns will allow you to accommodate these limitations. Going back to the example, in addition to nesting Sales and Budget within Years on columns I will now be able to show my measures in three other locations as follows:
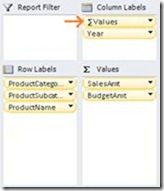
I can show Year nested within the Sales and the Budget Amount on columns:
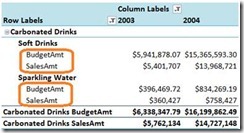
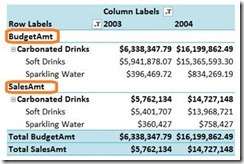
I can add measures to rows nesting Sales and Budget Amount within Product:
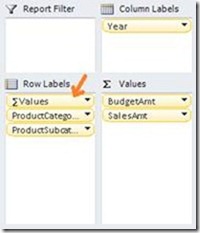
I can add measures to rows nesting products within Sales and Budget Amount:
In summary using CTP3 you will be able to show measures on rows in addition to columns and to show fields nested within measures on both rows and columns. An increased flexibility, which will greatly enhance the PivotTable layout
Hope this helps!
Comments
- Anonymous
July 15, 2011
this is really cool.nicely done!! - Anonymous
July 15, 2011
This is fantastic, thanks so much for sharing Julie. The SSAS team is doing an awesome job! Love the flexibility! - Anonymous
July 16, 2011
You can do this in Powerpivot v1 as well. The trick is to use the regular pivot table field list in stead of the Powerpivot field list. It's possible to open both field lists at the same time. Using the regular field list you can move the measures around. But great to see you've added this functionality to the powerpivot field list! - Anonymous
July 17, 2011
Thanks Greg, Dan and Frenk, glad you like it :)Frenk, you are absolutely correct: This functionality is available if you enable the Excel Field List, which is the workaround we do suggest for users of the current version of PowerPivot. However, given the amount of feedback we got from users asking for us to enable this particular feature, we decided to implement this natively for the PowerPivot Field List to eliminate the need of swtching back and forth between the two Field Lists. - Anonymous
December 09, 2011
Why i have install RC0 still can't use this function
