Note
Access to this page requires authorization. You can try signing in or changing directories.
Access to this page requires authorization. You can try changing directories.
If you find out that you have a large number of sc-status codes, e.g. 401, it could be an idea to check the sc-substatus codes.
SELECT
sc-status,
sc-substatus,
Count(*) AS Total
INTO 401subcodes.txt
FROM
logs\iis\ex*.log
WHERE
sc-status=401
GROUP BY
sc-status,
sc-substatus
ORDER BY
sc-status,
sc-substatus
DESC
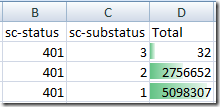
This is what it looked like at one of my customers
From https://support.microsoft.com/kb/318380 you’ll get more details, in this case 401s
401 - Access denied. IIS defines several different 401 errors that indicate a more specific cause of the error. These specific error codes are displayed in the browser but are not displayed in the IIS log:
- 401.1 - Logon failed.
- 401.2 - Logon failed due to server configuration.
- 401.3 - Unauthorized due to ACL on resource.
- 401.4 - Authorization failed by filter.
- 401.5 - Authorization failed by ISAPI/CGI application.
- 401.7 – Access denied by URL authorization policy on the Web server. This error code is specific to IIS 6.0.
If you like you can drill down further and check if any particular page is causing this or if any particular day had more errors. This script will give you each substatus per day
SELECT
TO_STRING(To_timestamp(date, time), 'MMdd') AS Day,
SUM(c1) AS 4011,
SUM(c2) AS 4012,
SUM(c3) AS 4013,
SUM(c4) AS 4014,
SUM(c5) AS 4015,
SUM(c7) AS 4017
USING
CASE sc-substatus WHEN 1 THEN 1 ELSE 0 END AS c1,
CASE sc-substatus WHEN 2 THEN 1 ELSE 0 END AS c2,
CASE sc-substatus WHEN 3 THEN 1 ELSE 0 END AS c3,
CASE sc-substatus WHEN 4 THEN 1 ELSE 0 END AS c4,
CASE sc-substatus WHEN 5 THEN 1 ELSE 0 END AS c5,
CASE sc-substatus WHEN 7 THEN 1 ELSE 0 END AS c7
INTO
401subcodesperday.txt
FROM
logs\iis\ex*.log
WHERE
sc-status=401
GROUP BY
Day
ORDER BY
Day
You could also check nr of sc-substatus generated by each ASPX page to get another angel.
SELECT
TOP 20 cs-uri-stem,
sc-status,
sc-substatus,
Count(*) AS Total
INTO 401Pagedetails.txt
FROM
logs\iis\ex*.log
WHERE
sc-status=401
GROUP BY
cs-uri-stem,
sc-status,
sc-substatus
ORDER BY
Total
At my customer we could easily spot that between mid August until beginning of September the 401.2 went up from average of 20.000/day over several weeks, to about 150.000/day. If you read my other posts this was due to a tool used on the servers at that time. If my customer had automated the process of creating above reports every day they would easily noticed an increase of several 100%. Better to be proactive then reactive!
//Anders
