Son of SPA: AD Data Collector Sets in Win2008 and beyond
Hello, David Everett here again. This time I’m going to cover configuration and management of Active Directory Diagnostics Data Collector Sets. Data Collector Sets are the next generation of a utility called Server Performance Advisor (SPA).
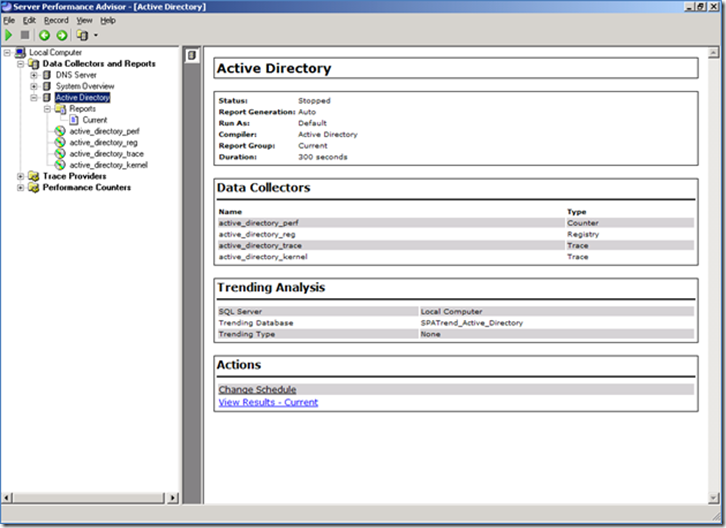
Prior to Windows Server 2008, troubleshooting Active Directory performance issues often required the installation of SPA. SPA is helpful because the Active Directory data set collects performance data and it generates XML based diagnostic reports that make analyzing AD performance issues easier by identifying the IP addresses of the highest volume callers and the type of network traffic that is placing the most load on the CPU. A screen shot of SPA is shown here with the Active Directory data set selected.
Those who came to rely upon this tool will be happy to know its functionality has been built into Windows Server 2008 and Windows Server 2008 R2.
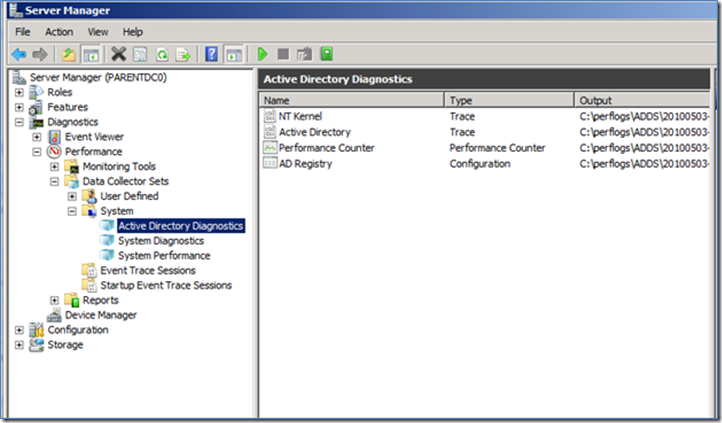
This performance feature is located in the Server Manager snap-in under the Diagnostics node and when the Active Directory Domain Services Role is installed the Active Directory Diagnostics data collector set is automatically created under System as shown here. It can also be accessed by running “Perfmon” from the RUN command.
Like SPA, the Active Directory Diagnostics data collector set runs for a default of 5 minutes. This duration period cannot be modified for the built-in collector. However, the collection can be stopped manually by clicking the Stop button or from the command line. If reducing or increasing the time that a data collector set runs is required, and manually stopping the collection is not desirable, then see How to Create a User Defined Data Collection Set below. Like SPA, the data is stored under %systemdrive%\perflogs, only now it is under the \ADDS folder and when a data collection is run it creates a new subfolder called YYYYMMDD-#### where YYYY = Year, MM = Month and DD=Day and #### starts with 0001.
Once the data collection completes the report is generated on the fly and is ready for review under the Reports node.
Just as SPA could be managed from the command line with spacmd.exe, data collector sets can also be managed from the command line.
How to gather Active Directory Diagnostics from the command line
- To START a collection of data from the command line issue this command from an elevated command prompt:
logman start “system\Active Directory Diagnostics” -ets
- To STOP the collection of data before the default 5 minutes, issue this command:
logman stop “system\Active Directory Diagnostics” -ets
NOTE: To gather data from remote systems just add “-s servername” to the commands above like this:
logman -s servername start “system\Active Directory Diagnostics” -ets
logman -s servername stop “system\Active Directory Diagnostics” -ets
This command will also work if the target is Server Core. If you cannot connect using Server Manager you can view the report by connecting from another computer to the C$ admin share and open the report.html file under \\servername\C$\PerfLogs\ADDS\YYYYMMDD-000#.
See LaNae’s blog post on How to Enable Remote Administration of Server Core via MMC using NETSH to open the necessary firewall ports.
In the event you need a Data Collection set run for a shorter or longer period of time, or if some other default setting is not to your liking you can create a User Defined Data Collector Set using the Active Directory Diagnostics collector set as a template.
NOTE: Increasing the duration that a data collection set runs will require more time for the data to be converted and could increase load on CPU, memory and disk.
Once your customized Data Collector Set is defined to your liking you can export the information to an XML file and import it to any server you wish using Server Manager or logman.exe
How to Create a User Defined Data Collection Set
- Open Server Manager on a Full version of Windows Server 2008 or later.
- Expand Diagnostics > Reliability and Performance > Data Collector Sets .
- Right-click User Defined and select New > Data Collector Set.
- Type in a name like Active Directory Diagnostics and leave the default selection of Create from a template (Recommended) selected and click Next.
- Select Active Directory Diagnostics from the list of templates and click Next and follow the Wizard prompts making any changes you think are necessary.
- Right-click the new User Defined data collector set and view the Properties.
- To change the run time, modify the Overall Duration settings in the Stop Condition tab and click OK to apply the changes.
Once the settings have been configured to your liking you can run this directly from Server Manager or you can export this and deploy it to specific DCs.
Deploying a User Defined Data Collection Set
- In Server Manager on a Full version of Windows Server 2008 or later
-
- Expand Diagnostics > Reliability and Performance > Data Collector Sets > User Defined
- Right-click the newly created data collector set and select Save Template…
- From the command line
1. Enumerate all User Defined data collector sets
logman query
NOTE: If running this from a remote computer the command add “-s servername” to target the remote server
logman -s servername query
2. Export the desired collection set
logman export -n “Active Directory Diagnostics” -xml addiag.xml
3. Import the collection set to the target server.
logman import -n “Active Directory Diagnostics” -xml addiag.xml
NOTE: If you get the error below then there’s an SDDL string in the XML file between the <Security></Security> tags that is not correct. This can happen if you export the Active Directory Diagnostics collector set under System. To correct this, remove everything between <Security></Security> tags in the XML file.
Error:
This security ID may not be assigned as the owner of this object.
4. Verify the collector set is installed
logman query
5. Now that the data collector set is imported you’re ready to gather data. See How to gather Active Directory Diagnostics from the command line above to do this from the command line.
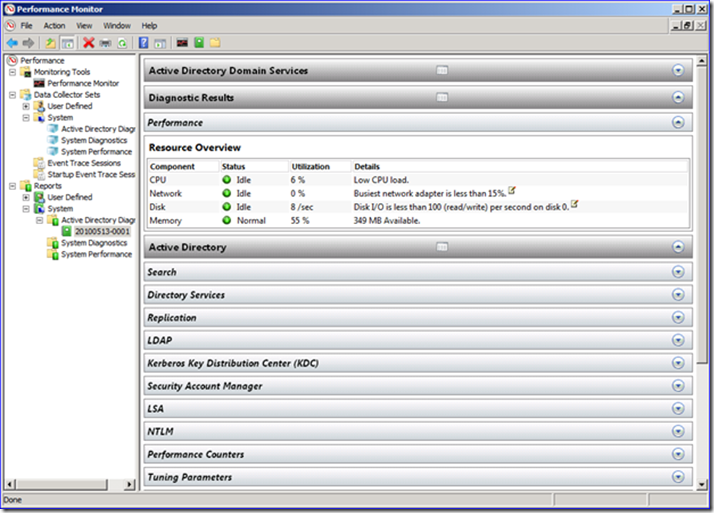
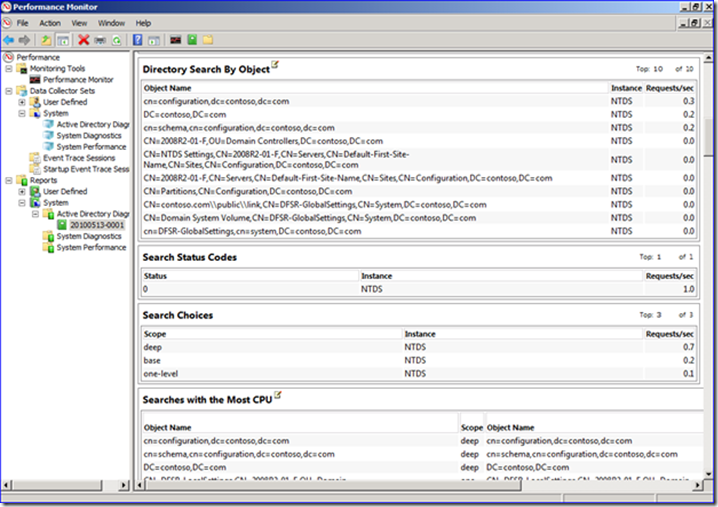
Once you’ve gathered your data, you will have these interesting and useful reports to aid in your troubleshooting and server performance trending:
In short, all the goodness of SPA is now integrated into the operating system, not requiring an install or reboot. Follow the steps above, and you'll be on your way to gathering and analyzing lots of performance goo.
David “highly excitable” Everett
Comments
Anonymous
June 11, 2010
Is there a way to schedule the built in systemactive directory diagnostics data collector? I see there is a tab but I can't mdofiy it. Thank youAnonymous
June 11, 2010
There's no way to modify anything on the built-in really. It's intentioanlly protected from being broken through carelessness. You have to create a new one, like Dave described above.Anonymous
June 22, 2010
I have become very dependent on SPA in 2003 for lots of external LDAP calls we have coming into AD, and now that we are migrating to AD 2008, I am trying to get familiar with data collector sets. The one thing I havent been able to find is how to set the equivalent verboseness of SPA "expertlevel" in inside of 20080 data collector sets/trace providers. I see 'level' but that does not seem to have the same affect, at least setting it at a value of 10(0x0a) like I did in SPA.


