Walk through major features of Microsoft Dynamics AX 2012 Trace Parser (Part 2)
Analyze traces
Open Traces
Once a trace file is imported, it is automatically opened in Trace Parser. Alternatively, users can click the “File -> Open trace” menu item to bring up the “Select trace” dialog to open an imported trace.
Select session
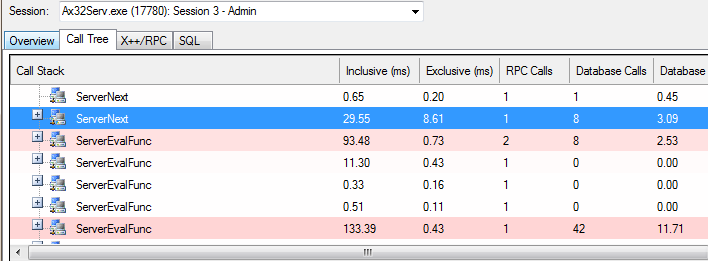
Click the Session drop-down combo box to bring up session list:
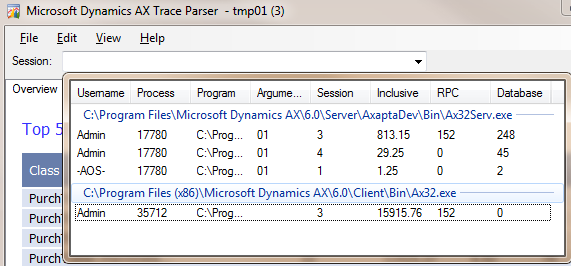
The example above shows three server sessions (the sessions under “Ax32Serv.exe”) and one client session (the session under Ax32.exe). Note that server session (Session #3) is correspondent to the client session (Session #3), and that forms a “session pair”. In many cases the “session pairs” are the main analysis targets since they capture the full footprints of certain scenarios.
Only server sessions contain database calls (SQL events).
Overview, Call Tree, X++/RPC report and SQL Report
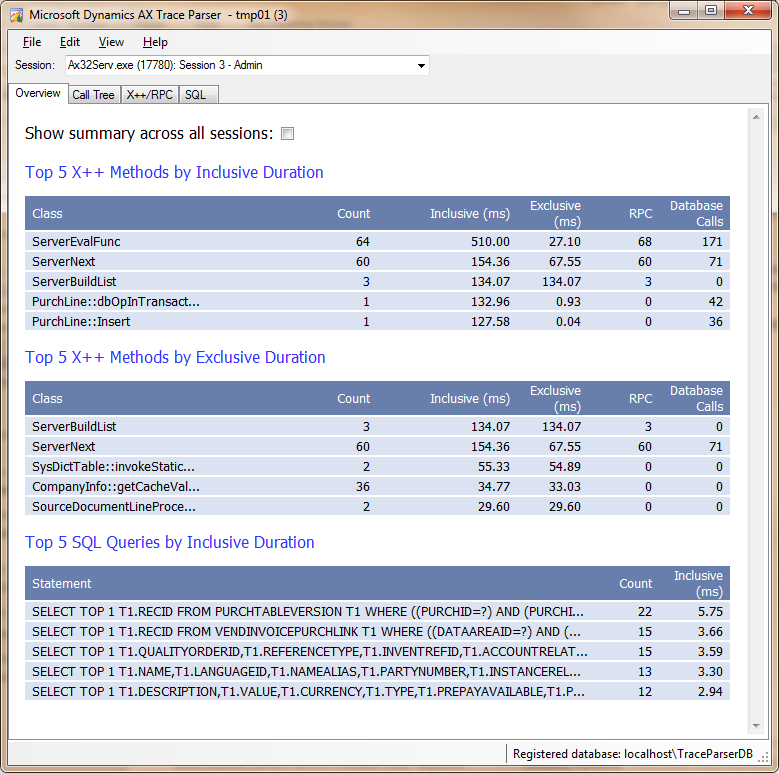
Overview
After a session is selected, Overview page displays the topmost expensive X++ or SQL calls in the session (User can check the “Show summary across all sessions” checkbox to display the overview of the trace across all sessions).
Call Tree
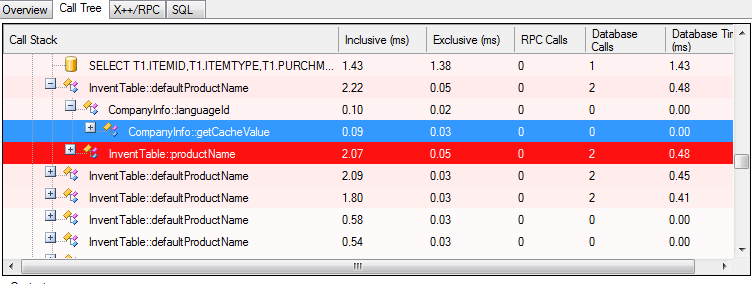
Call Tree organizes and renders tracing events in a tree-like UI control. The events are organized as a list of “call stacks” in chronological order:
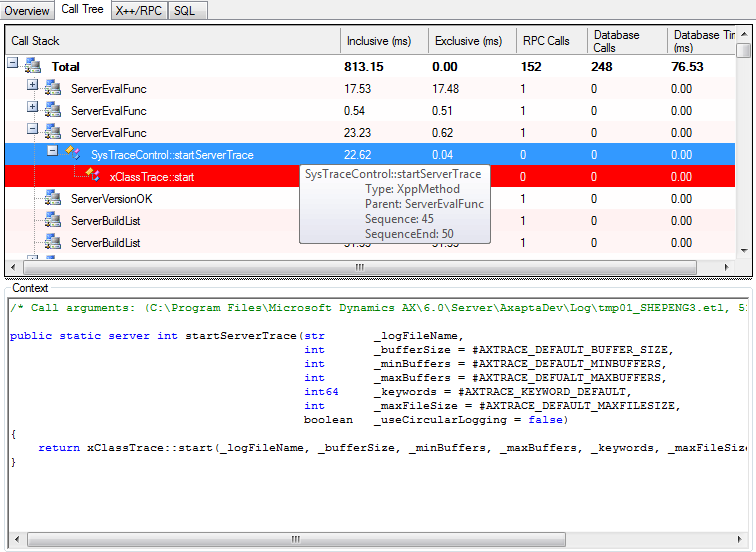
Relatively “expensive” calls are emphasized with different colors (the red line in the screenshot above, for example). For example, if a method call foo() takes up 70% time of its parent method bar(), foo() will be highlighted with deep red. The more percentage it take up, the deeper the color. In our previous example, if another method foo2() takes up another 20% time of parent method bar(), foo2() will have a lighter red color than foo() has.
The Context area displays information about the currently selected event. For X++ method calls, source code is displayed (if an AOS connection is available), and if “Xpp Parameters Info” events are available, the call arguments are displayed as a comment line before the source code. For SQL events, full SQL statement is displayed. If “Bind Parameters” events are available, query parameters are displayed in the SQL statements.
X++/RPC report
X++/RPC report displays information about X++ and RPC events in a sortable data grid. It has two sub-views: Aggregate and non-Aggregate. Aggregate view shows summary information of X++/RPC events grouped by names, and non-Aggregate view displays the detailed information of single X++/RPC event. Toggle the “Show Aggregate” check box to switch between two views.
Name Filter is used to search for particular X++/RPC events by name, and it supports use of wildcard. Typing “*::write*”, for example, will list all X++ method names that contain a substring “::write”.
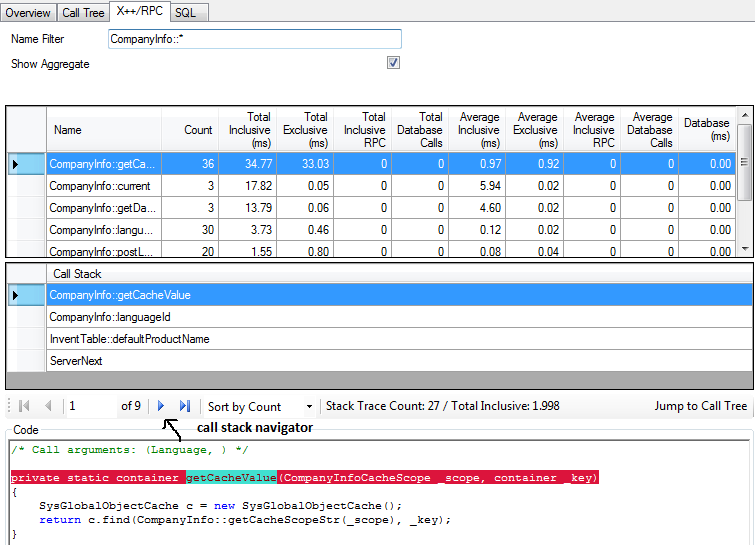
Call Stack displays call path from top-most caller to the currently selected X++/RPC method. As X++/RPC can be called from multiple paths, the call stack navigator is used to navigate through all the calling paths.
Clicking on the “Jump to Call Tree” button switches the current view to Call Tree and displays the selected X++/RPC method:
The Code text area displays the source code of the select X++ event. If “Xpp Parameters Info” events are collected in the trace, the first line is always the call arguments of the X++ method.
SQL report
SQL report is very similar to X++/RPC report; SQL report displays SQL events in a sortable data grid.
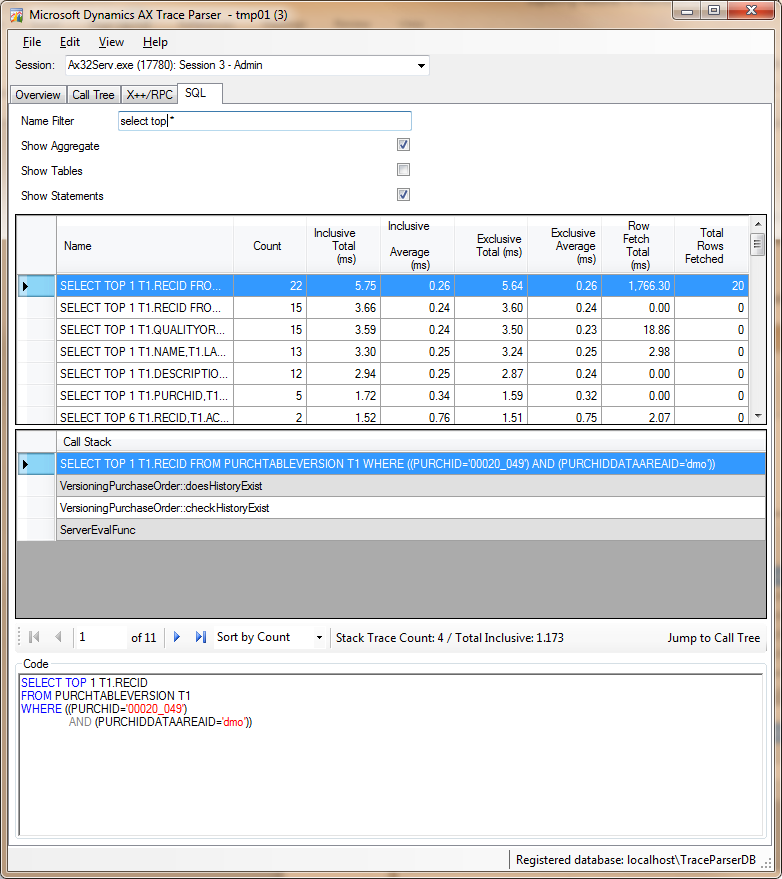
By default, “Show Statements” is checked, which means the “Name” columns contains the full SQL statements. If “Show Table” is checked, the “Name” column displays table name only.
More about navigation
The “Jump to Call Tree” button in X++/RPC report and SQL report navigate users from X++/RPC or SQL report to Call Tree. There are more navigation features in Trace Parser that help users navigating between different views or sessions.
Drill through sessions
Server and clients tracing events are logged in different sessions, and Trace Parser can open one session at a time. Feature “Drill through sessions” helps to connect events in client and server sessions (the “session pair”). Note this feature is available only if a trace contains both client and server sessions.
Look at a typical scenario: “Method_C” in client invokes an RPC; Server receives the RPC, and then the RPC invokes “Method_S” in server:
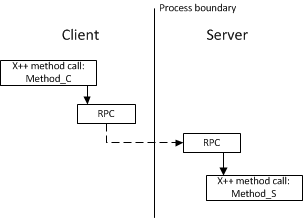
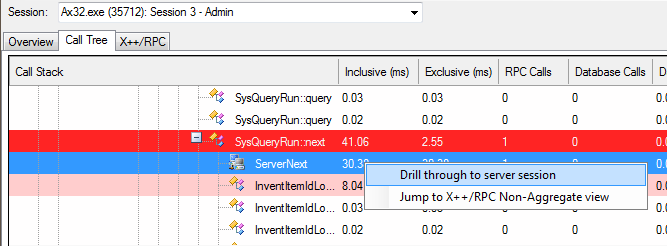
If a user is looking at a RPC event in the client session, and he likes to follow through to the server session to check the details of the RPC, he can use the “Drill through to server session” command to open the server session and locate the corresponding RPC.
Similarly, user can “jump” to client session from server session using the “Drill through to client session” command.
To Drill through session:
In Call Tree, select and right click a RPC node, click the “Drill into [Server | Client] session” menu item:
Trace Parser will open the sever or client session and search for the corresponding RPC:
Navigate from Call Tree to X++/RPC or SQL report
In Call Tree, right-click a node to bring up the context menu:
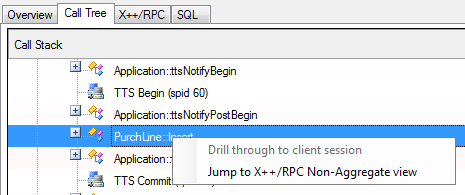
(If the node is a SQL event node, the context menu will display “Jump to SQL Non-Aggregate” view”.)
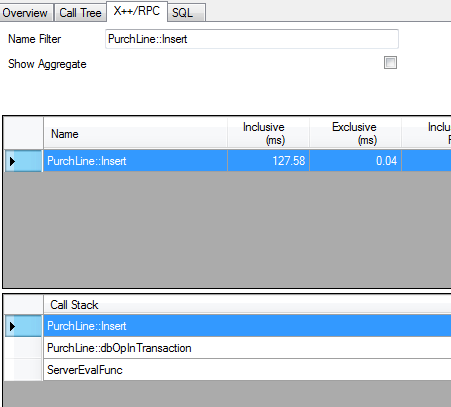
Click “Jump to X++ Non-Aggregate view”. The current view is switched to X++/RPC report’s “Non-Aggregate view” (the “Show Aggregate” is unchecked) with the Name Filter set to the event name:
For SQL event in Call Tree, “Jump to SQL Non-Aggregate” view brings user to the Non-Aggregate view of SQL report, with the Name Filter set to the SQL statement.
Quick navigation from Aggregate to Non-Aggregate view.
In both RPC/X++ and SQL report when “Show Aggregate” is checked, right clicking on any row in the main data grid or the call stack brings up a context menu:
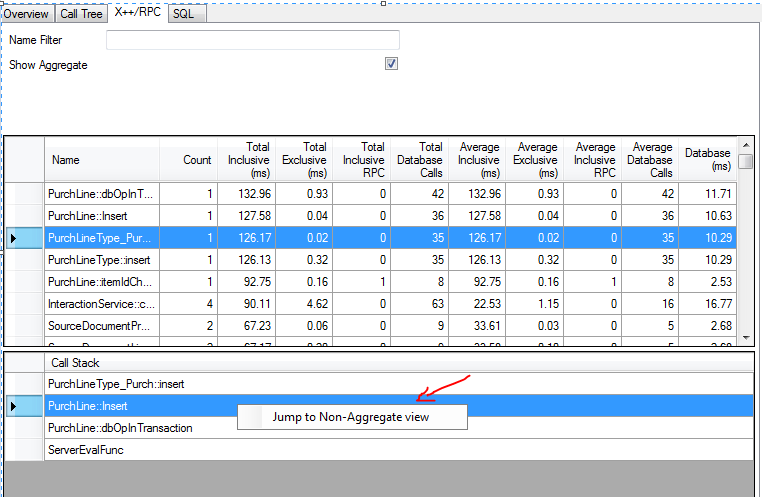
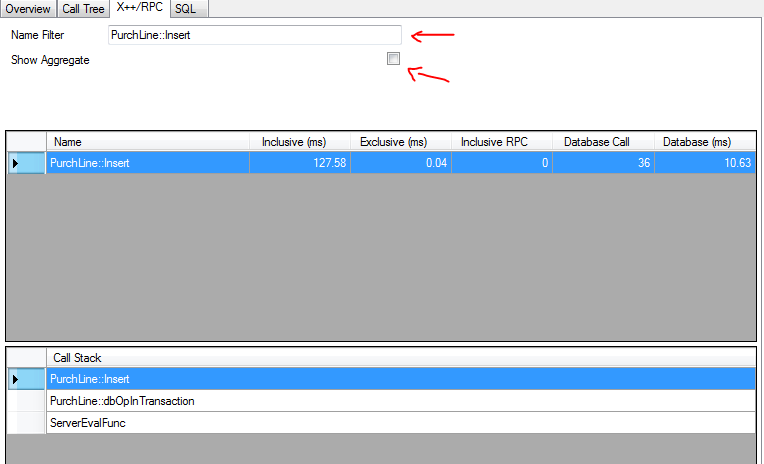
Click the “Jump to Non-Aggregate” menu item. The “Show Aggregate”” is switched off and the Name Filter is set with the selected event name:
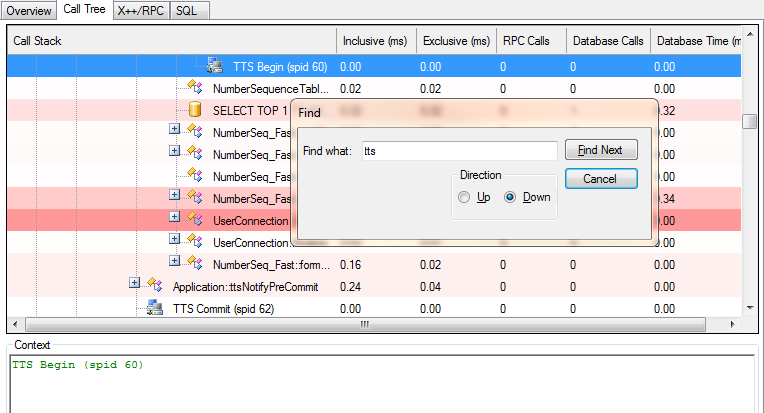
Search in Call Tree
User can search for event node by name in the Call Tree. Press Ctrl + F to bring up the “Find” window, type a name string and click “Find Next”: