Note
Access to this page requires authorization. You can try signing in or changing directories.
Access to this page requires authorization. You can try changing directories.
By Yi Wang and Mangesh Sangapu
Find the matching version of xdebug extension from "D:\devtools\xdebug\2.4.0\",for example, if you have PHP 5.6, use "D:\devtools\xdebug\2.4.0\php_5.6\php_xdebug-2.4.0-5.6-vc11-nts.dll".
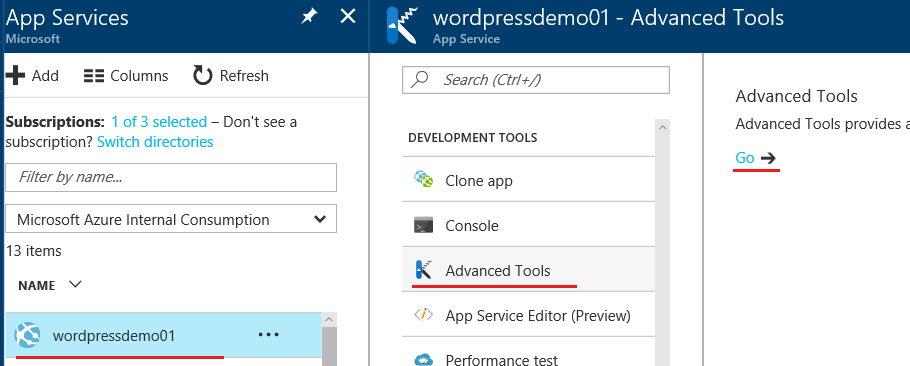
To access D: drive, use Kudu <your-website-name>.scm.azurewebsites.net, or "Advanced Tools" in Azure portal,
Add Xdebug extension in Application Settings->App settings:
PHP_ZENDEXTENSIONS = D:\devtools\xdebug\2.4.0\php_5.6\php_xdebug-2.4.0-5.6-vc11-nts.dll
Create Xdebug profile output directory "D:\home\site\wwwroot\bin\xdebug_profiles"
Create "D:\home\site\wwwroot\.user.ini", add follow in settings in ".user.ini"
xdebug.profiler_enable=0
xdebug.profiler_output_dir="D:\home\site\wwwroot\bin\xdebug_profiles"
xdebug.profiler_enable_trigger=1(Note: To enable Xdebug all the time, set "xdebug.profiler_enable=1", and remove "xdebug.profiler_enable_trigger" )
Trigger Xdebug profiling as "https://<your-site>/<page-name>.php?XDEBUG_PROFILE=1"
Additional Settings
To append the filename to the xdebug output filename, use the following setting in .user.ini:
xdebug.trace_output_name = cachegrind.out.%s
| Specifier | Meaning | Example Format | Example Filename |
| %s | script name 2 | cachegrind.out.%s | cachegrind.out._home_httpd_html_test_xdebug_test_php |
Links to Xdebug Profile Viewers
Xdebug Reference Documentation https://xdebug.org/docs/
More reference Troubleshooting PHP Performance in Microsoft Azure Web Sites with Xdebug