SQL Server 2017 Showplan enhancements
Cross post with https://aka.ms/sqlserverteam
In my previous post on Easy way to get statistics histogram programmatically, I referred to statistics as the building blocks on which the Query Optimizer reasons to compile a good enough plan to resolve queries. Knowing the status of distribution statistics over a given table and set of columns allows the user to have insight into how SQL Server might have used or misused the existing information.
Towards the end of that post, I show an example on how you can leverage some DMFs inline, in order to to get information on which stat and respective histogram steps cover my predicate, in the scope of my table and column.
We are happy to announce that identifying which statistics were in fact used by the Query Optimizer for a given compilation has become much easier: they are now part of Showplan.
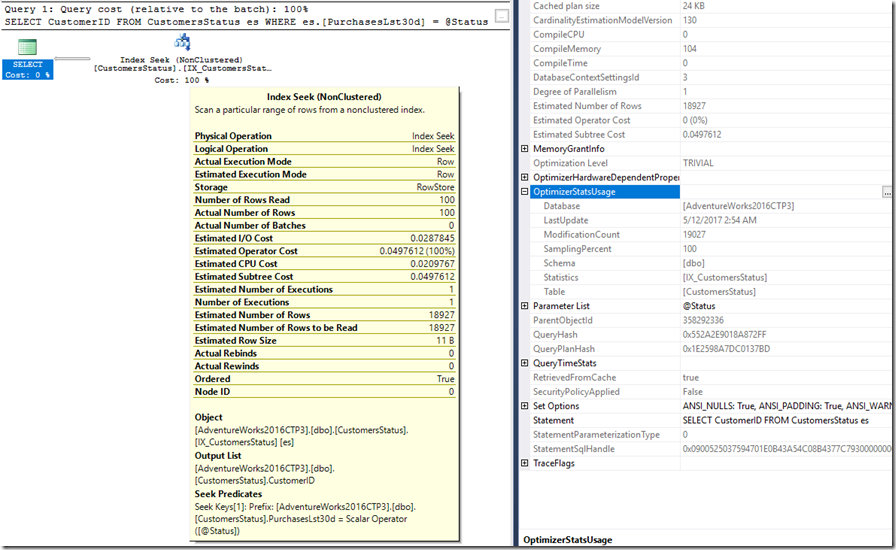
When looking at the properties of the root node, here’s what we know: one statistic object [IX_CustomerStatus] was used by the Query Optimizer, and I can see several statistic properties like SamplingPercent, current ModificationCount and when it was last updated.
OptimizerStatsUsage is available in cached plans, so getting the “estimated execution plan” and the “actual execution plan” will have this information.
In the above example, I see the ModificationCount is very high (almost as much as the table cardinality itself) which after closer observation, the statistic had been updated with NORECOMPUTE.
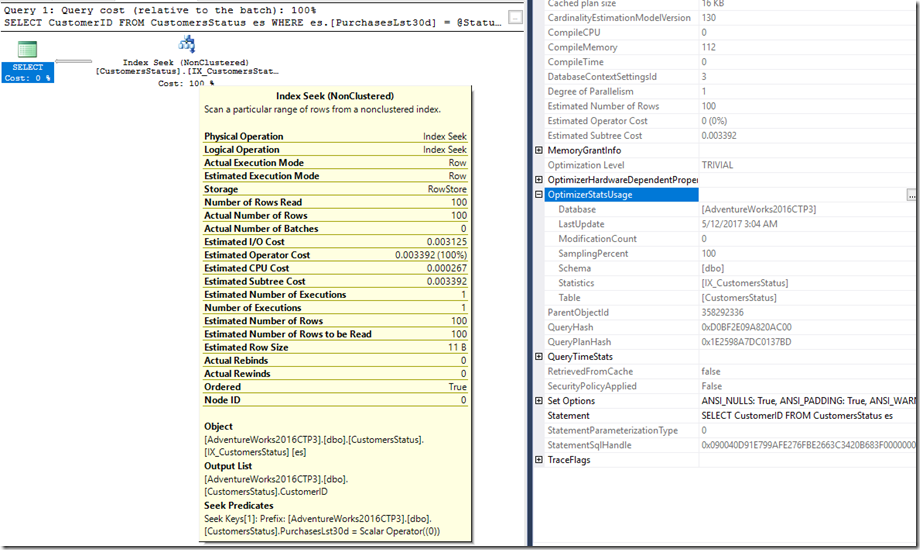
And looking and the Seek itself, there is a large skew between estimated and actual rows. In this case, I now know a good course of action is to update statistics. Doing so produces this new result: ModificationCounter is back to zero and estimations are now correct.
Pedro Lopes (@sqlpto) – Program Manager

