The Growing Power of Visualization – the next phase of markets
Too much information and too little time to absorb it - that's the dilemma of the financial markets today. We have more data than we can possibly absorb: spreadsheets with tens of columns and thousands of rows; news headlines streaming faster than the human eye can read.......
Yet the data tsunami continues to overwhelm us with almost every statistic imaginable.
So how can we process it all and see what information really counts?
Despite the takeover of markets by technology, human beings are still in charge of risk management and trading strategy and for this they need insight into how markets are moving.
Enter the next stage in the evolution of markets - data visualization.
Over the years there has been a huge sea change in the technology of computerized imaging. We have mastered the ability to turn massive amounts of 2D data into 3D information - from numbers into pictures and moving pictures at that. Visualization that used to require dedicated and expensive hardware is now possible on commodity-priced desktops.
A Microsoft partner, Aqumin (www.aqumin.com), is launching this technology in the financial services space. Their product Alpha Vision translates real-time market data into a dynamic panorama of the market place. Data that would normally require several trading screens to present can now be captured on a single screen lifting the fog of markets.
The co-founders of Aqumin originally developed this technology for the energy industry transforming massive seismic datasets, well logs and other related data into lucid, interpretable 3D images of hydrocarbon reservoirs in real time.
With Alpha Vision if you were following a sector you can now trade across a market or several markets. If you were trading say 25 bonds you can now trade 100 or more. If you are in charge of a dealing room you can pinpoint the position of each dealer as his portfolio changes. If you are a risk manager you can see your exposures in relation to your risk appetite moving as the markets move.
Even managing latency by client or counterparty is now a practical reality.
To the cynical this might seem like just another set of beautiful images. But the real purpose of visualization is insight not pictures and insight in financial markets carries a huge premium that can make a game-changing difference to financial performance.
Visual analytics leverages the fact that the brain is more attracted to and able to process dynamic images than millions of numbers. But the goal of information visualization is not simply to represent millions of bits of data as illustrations. It is to prompt instinctive comprehension, moments of insight that make viewers want to learn more.
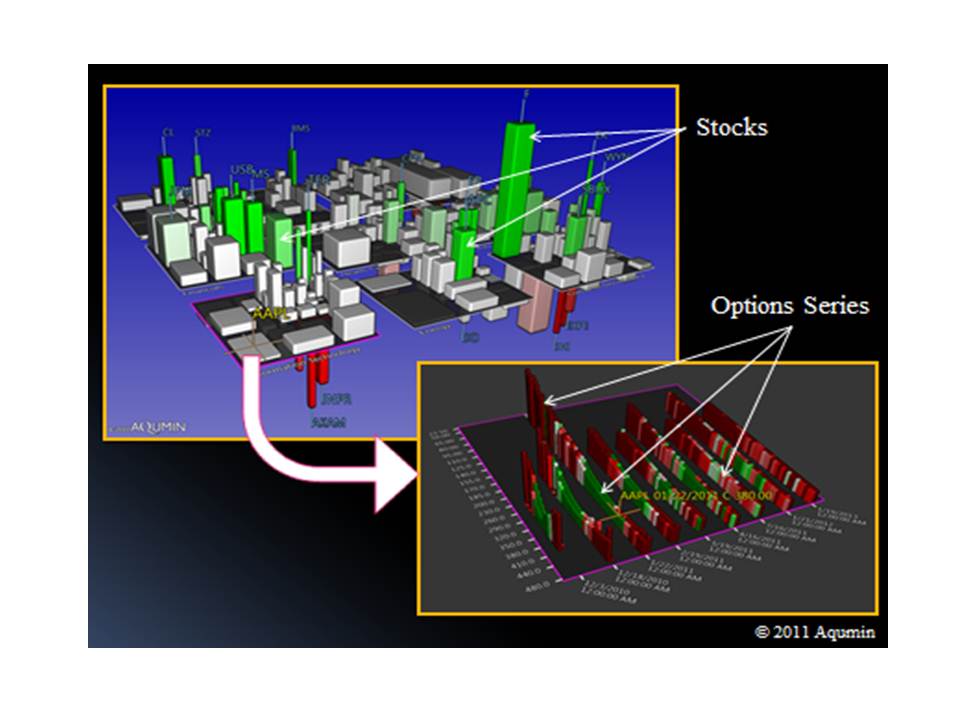
An example of Aqumin images showing the stock market and options details. The buildings represent stocks, their height and color market movements.
Alpha Vision represents data in terms of buildings and plates with the height of the buildings and their color providing critical insight into how markets are changing. Click on a building representing a security whose height and color signals a potential market opportunity and you can dive into the detail of that asset for more information.
We cannot afford to fly too high in a world of too much data. But thanks to the magic of data visualization technology, we can have instant access to on-the-ground information that enables us to manage financial markets more skillfully than before.
For a more detailed presentation of Alpha Vision please access the following URL:
https://www.aqumin.com/clientfiles/MSFTVignettesFinal5atg.pdf
Comments
- Anonymous
April 06, 2011
Sure, this type of visualization is great, though 3D brings only one dimension in charting. Skills are learned, and no matter how good a chart is, that won't help you unless you are having a deep understanding of the processes, data sources, quality of data, events associated with various data points, the possibility to label things and reuse the labels in your analysis. Is needed also additional functionality that would help people make most of the data. - Anonymous
April 06, 2011
Thanks for your post Adrian. I agree the image is not enough. You need access to the underlying data which this solution provides. You are also quite correct that you need to understand the underlying processes, etc. Just like driving a car really. You can get more out of it if you understand how the engine works, but you certainly don't want to drive in the dark without the headlights on. Thanks again for your post. Regards, David - Anonymous
April 06, 2011
The space is interactive so all of the data is accessible. You can mark and flag any point you see. The question is how do you make a professional better?How do you get the improvement in performance at the margins? You need to see more, faster with more accuracy. Financial professionals have multiple screens for that very reason. Visualization turns 3 screens into 1.Andrew