Note
Access to this page requires authorization. You can try signing in or changing directories.
Access to this page requires authorization. You can try changing directories.
Hello again.
Today's case is pretty interesting, in my opinion, because it merges a number of different areas.
We'll start from the analysis of a memory corruption to go to Runtime Callable Wrappers in the .NET CLR to finish with COM objects lifetime considerations. If all that sounds interesting, or at least not too boring or scaring , please stay with me as we start the analysis.
The Problem
The problem is reported as a 100% CPU usage in a customer-written, managed application. The problem happens, most of the times, at application shutdown, occasionally in other circumstances.
Dump Analysys - Understanding the reason for the high CPU usage
When an application takes 100% of CPU time (or 50%, or 25%, depending on the number of processors), it is usually an indication that one of its threads ran into an endless loop.
All we have to start with is a dump of the process taken at this time, so let's have a look at the dump first.
Note
When analyzing a 100% CPU issue, analysis of one single dump is not the best way to identify the problem. A set of dumps (for example 3 or 4 dumps taken at short interval, say 30 seconds) is much better because it makes it possible to inspect the call stack of the threads at different stages in the endless loop and therefore to possibly understand why we are staying endlessly in the loop. With a single dump, careful analysis of each of the stack frames, including its state (local variables and parameters) is required, and this can be time consuming. Even more sophisticated techniques can be used to identify endless loops, for example profiling. Note however that these techniques are sometimes impractical if the problem happens seldom, or if it only happens in production environments or on remote machines at customer's locations.
As usual, let's set the symbol path:
 0:000>  .sympath srv*c:\publicsymbols*https://msdl.microsoft.com/download/symbols
Symbol search path is: srv*c:\publicsymbols*https://msdl.microsoft.com/download/symbols
0:000>  .reload
Then let's check the CPU usage for each thread with the !runaway command:
 0:000>  !runaway
 User Mode Time
  Thread       Time
   0:714       0 days 2:38:16.218
   1:b4c       0 days 0:00:00.000
Thread 0 is the main thread, and its CPU usage of more than 2 hours shows that this is the thread which is taking all the CPU time. Thread 1 is the thread that was injected by the debugger in order to break the process and take a dump and, as expected, it took practically no CPU time. Under normal circumstances the process would have many other threads but at this stage the process is shutting down and all the other threads have already terminated.
This is the call stack for the main thread:
 0:000> kb200
ChildEBP RetAddr  Args to Child
0012f91c 773f8417 001a0000 001adeb8 0012f9c4 ntdll!RtlpCoalesceFreeBlocks+0x4db
0012fa14 773f8652 001ade30 001ade38 001ade38 ntdll!RtlpFreeHeap+0x1e2
0012fa30 772fc56f 001a0000 00000000 001ade30 ntdll!RtlFreeHeap+0x14e
0012fa44 70fc4c39 001a0000 00000000 001ade38 kernel32!HeapFree+0x14
0012fa90 790aeebd 001ade38 00000001 00000000 msvcr80!free+0xcd
0012faa8 790aef38 79060000 75d3c590 00000001 mscorjit!_CRT_INIT+0x195
0012faec 790a5e16 79060000 773ce1c4 79060000 mscorjit!_CRT_INIT+0x27a
0012faf4 773ce1c4 79060000 00000000 00000001 mscorjit!_DllMainCRTStartup+0x1d
0012fb14 773ba8dd 790a5df9 79060000 00000000 ntdll!LdrpCallInitRoutine+0x14
0012fbb4 773ba85f 0012fbd0 772d3b69 00000000 ntdll!LdrShutdownProcess+0x1a9
0012fbbc 772d3b68 00000000 77e8f3b0 ffffffff ntdll!RtlExitUserProcess+0x64
0012fbd0 79fd9e8f 00000000 00000000 00000001 kernel32!ExitProcess+0x12
0012fdf8 79f7479c 00000000 0012fe3c 79f7394a mscorwks!SafeExitProcess+0x157
0012fe94 79004fab 00000000 79e70000 0012fef0 mscorwks!DisableRuntime+0xd1
0012fea4 70fc170b 00000000 70fc1715 00000000 mscoree!CorExitProcess+0x46
0012feac 70fc1715 00000000 70fc1a04 00000000 msvcr80!__crtCorExitProcess+0x25
0012feb4 70fc1a03 00000000 d8c61ab3 0041b120 msvcr80!__crtExitProcess+0x9
0012fef0 70fc1a4b 00000000 00000000 00000000 msvcr80!_cinit+0x101
0012ff00 0040ef5f 00000000 d8c868b0 00000000 msvcr80!exit+0xd
WARNING: Stack unwind information not available. Following frames may be wrong.
0012ff88 772f4911 7ffdf000 0012ffd4 773ce4b6 LXDeviceServer+0xef5f
0012ff94 773ce4b6 7ffdf000 58366917 00000000 kernel32!BaseThreadInitThunk+0xe
0012ffd4 773ce489 0040f0bb 7ffdf000 00000000 ntdll!__RtlUserThreadStart+0x23
0012ffec 00000000 0040f0bb 7ffdf000 00000000 ntdll!_RtlUserThreadStart+0x1b
The callstack above confirms that the process is shutting down. As part of shutdown of a managed application, the CLR is also shutting down.
We already talked about ntdll!RtlpCoalesceFreeBlocks in a previous post. In that case, an access violation was a consequence of a previous heap corruption. Let's try and understand what happens in this case.
In the previous post we also enphasized that some of the heap data structures changed in Vista / Windows Server 2008, so let's check which operating system this process was running on:
 0:000> vertarget
Windows Server 2008/Windows Vista SP1 Version 6001 (Service Pack 1) MP (2 procs) Free x86 compatible
Product: WinNt, suite: SingleUserTS
kernel32.dll version: 6.0.6001.18000 (longhorn_rtm.080118-1840)
So this gives us the chance to look at the new heap data structures of Windows Vista and Windows Server 2008.
We are freeing memory at address 001a0000. As part of the free, the heap manager tries to coalesce this block with nearby (previous and / or following) blocks in an attempt to reduce heap fragmentation. While doing so, the heap manager seems to have entered the endless loop.
Upon further analysis, very similar to the one in the previous post, we can conclude that the cause of the problem is heap corruption. More precisely, a heap block that was previously freed and placed in the heap free list has been subsequently accessed by the program, overwriting the fields that chain the list (remember, when a block is freed the booking information is stored in the user-accessible part of the heap block). The corruption just so happened to create a circular list, thus causing ntdll!RtlpCoalesceFreeBlocks() to enter an endless loop while scanning the list items.
Looking for the source of the heap corruption
One important information coming from our customer is that not all the runs create the problem in the same way. So let's try and run the application under the debugger for some times and check what happens at different runs.
One such run causes a first-chance Access Violation (AV) with this call stack:
 0:000> kb30
ChildEBP RetAddr  Args to Child
0012efd0 79e7e432 0002ded0 002bd9b8 22b60a79 mscorwks!SafeReleaseHelper+0x77
0012f004 79f86f8f 0002ded0 002bd9b8 22b60a45 mscorwks!SafeRelease+0x2f
0012f038 79f86e9c 002bd9b8 00000001 002bd9bc mscorwks!IUnkEntry::Free+0x68
0012f04c 79f86e7a 22b60a01 00000001 002bd9b8 mscorwks!RCW::ReleaseAllInterfaces+0x18
0012f07c 79f86efc 002bd9b8 22b60ad1 00000001 mscorwks!RCW::ReleaseAllInterfacesCallBack+0xbd
0012f0ac 79f8787e 035ae598 0012f0e8 79f87846 mscorwks!RCW::Cleanup+0x22
0012f0b8 79f87846 002bda50 22b60a95 0012f104 mscorwks!RCWCleanupList::ReleaseRCWListRaw+0x16
0012f0e8 7a0bf7a6 002622b0 002622b0 0012f114 mscorwks!RCWCleanupList::ReleaseRCWListInCorrectCtx+0xdf
0012f0f8 76302fe0 035ae434 0012f118 0012f334 mscorwks!CtxEntry::EnterContextCallback+0x89
0012f114 7647333b 00268198 03f18e48 00000202 ole32!CRemoteUnknown::DoCallback+0x7a
0012f130 764e0841 76302fa5 0012f338 00000002 rpcrt4!Invoke+0x2a
0012f55c 764e0ff6 00262010 0026a740 00314f68 rpcrt4!NdrStubCall2+0x27b
0012f5ac 76409759 00262010 00314f68 0026a740 rpcrt4!CStdStubBuffer_Invoke+0xa0
0012f5f4 764096f3 00314f68 002f3764 00000000 ole32!SyncStubInvoke+0x3c
0012f640 76329d67 00314f68 0026a650 00262010 ole32!StubInvoke+0xb9
0012f71c 76329c5c 0026a740 00000000 00262010 ole32!CCtxComChnl::ContextInvoke+0xfa
0012f738 7632aab0 00314f68 00000001 00262010 ole32!MTAInvoke+0x1a
0012f764 7640961b 00314f68 00000001 00262010 ole32!STAInvoke+0x46
0012f798 76409498 d0908070 0026a740 00262010 ole32!AppInvoke+0xaa
0012f874 76409aa2 00314f10 00270328 00000000 ole32!ComInvokeWithLockAndIPID+0x32c
0012f89c 7632a8ea 00314f10 00000400 00265ee8 ole32!ComInvoke+0xc5
0012f8b0 7632a8a9 00314f10 0012f970 00000400 ole32!ThreadDispatch+0x23
0012f8f4 765cf8d2 00030058 00000400 0000babe ole32!ThreadWndProc+0x167
0012f920 765cf794 7632a80c 00030058 00000400 user32!InternalCallWinProc+0x23
0012f998 765d0008 00000000 7632a80c 00030058 user32!UserCallWinProcCheckWow+0x14b
0012f9fc 765d0060 7632a80c 00000000 0012fa3c user32!DispatchMessageWorker+0x322
0012fa0c 762fb0a6 0012fa20 00000000 0012fb08 user32!DispatchMessageW+0xf
0012fa3c 762f8a9d 00000102 00080008 762faff5 ole32!CCliModalLoop::PeekRPCAndDDEMessage+0x4c
0012fa6c 762f89d7 00080008 2286611c 00000102 ole32!CCliModalLoop::FindMessage+0x30
0012fac8 762f898f 80010115 80010115 0026abe8 ole32!CCliModalLoop::HandleWakeForMsg+0x3e
0012fadc 762f5384 0026abe8 00013880 0012fb04 ole32!CCliModalLoop::BlockFn+0x108
0012fb58 79f752f0 00000002 00013880 00000001 ole32!CoWaitForMultipleHandles+0xcd
0012fb78 79f75232 00000000 00013880 00000001 mscorwks!NT5WaitRoutine+0x51
0012fbe4 79f7519a 00000001 0026abe8 00000000 mscorwks!MsgWaitHelper+0xa5
0012fc04 79ed9808 00000001 0026abe8 00000000 mscorwks!Thread::DoAppropriateAptStateWait+0x28
0012fc88 79ed96c4 00000001 0026abe8 00000000 mscorwks!Thread::DoAppropriateWaitWorker+0x13c
0012fcd8 79ed9a62 00000001 0026abe8 00000000 mscorwks!Thread::DoAppropriateWait+0x40
0012fd34 79e78944 00013880 00000001 00000000 mscorwks!CLREvent::WaitEx+0xf7
0012fd48 79f7515d 00013880 00000001 00000000 mscorwks!CLREvent::Wait+0x17
0012fdc8 79f750b9 79f7509d 22b60785 00000000 mscorwks!WaitForEndOfShutdown_OneIteration+0x9f
0012fdcc 79f7509d 22b60785 00000000 00000000 mscorwks!WaitForEndOfShutdown+0x5
0012fdf8 79f7478c 00000eb0 0012fe3c 79f7394a mscorwks!EEShutDown+0xae
0012fe94 79004fab 00000000 79e70000 0012fef0 mscorwks!HandleExitProcessHelper+0x41
0012fea4 72f4170b 00000000 72f41715 00000000 mscoree!CorExitProcess+0x46
0012feac 72f41715 00000000 72f41a04 00000000 msvcr80!__crtCorExitProcess+0x25
0012feb4 72f41a03 00000000 22866778 0041b120 msvcr80!__crtExitProcess+0x9
0012fef0 72f41a4b 00000000 00000000 00000000 msvcr80!doexit+0xc1
0012ff00 0040ef5f 00000000 2285db91 00000000 msvcr80!exit+0xd
 0:000>  .exr -1
ExceptionAddress: 79e7e4a5 (mscorwks!SafeReleaseHelper+0x00000077)
   ExceptionCode: c0000005 (Access violation)
  ExceptionFlags: 00000000
NumberParameters: 2
   Parameter[0]: 00000000
   Parameter[1]: 00000008
Attempt to read from address 00000008
Note
A question I would expect at this stage is: why doesn't this exception tear down the process? Or, in other words, who is handling this exception, thus preventing the process from terminating? It is the CLR itself which does that by wrapping the call to Release() on COM objects in an exception handler which basically ignores the exception and allows the program to continue. This has been done in order to be forgiving towards those COM objects that do not handle their lifetime properly and avoid that they can tear down the whole process.
RCW represents, in the CLR runtime, a Runtime Callable Wrapper, the .NET interface to a COM object. Before making a sense of the call stack above, it is helpful to underline some key points on the lifetime of COM objects and on how RCWs handle it:
- COM objects are reference-counted: they keep track of how many clients are keeping a reference to them. They can safely delete themselves when the reference count drops to 0.
- A RCW is just another client of a COM object. As such, it may keep one or more references to the COM object.
- A RCW, like other managed objects, is not released deterministically, but through Garbage Collection (GC). It is at this stage, by default, that it calls Release() on the referenced COM object.
- It is possible to force the release of the underlying COM object before the RCW undergoes GC by calling Marshal.ReleaseComObject().
Without looking into the undocumented RCW structure, we know from the call stack above that it is releasing a reference to a COM object at address 0002ded0. So we can check with our customer which type of COM Interoperability takes place in their application. It turns out their application uses COM Connectable Objects in managed form (this can be achieved by using the ComSourceInterfacesAttribute attribute). Some of their sinks are managed, some are native. So COM Interoperability takes place for native COM sinks. When a connectable object has one or more sinks to notify when an event occurs, it must obviously keep a reference to them. At the same time, the sink typically keeps a reference to the connectable object because it will sooner or later disconnect from it by calling IConnectionPoint::Unadvise. With COM Interop in-between, the overall picture is as follows:
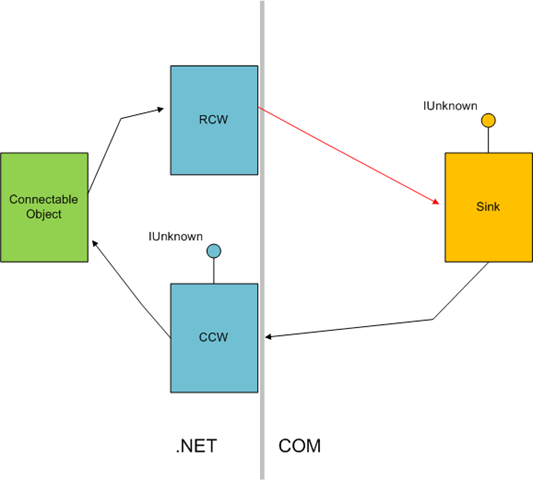
Now, we know that we get an AV when the RCW releases the underlying Sink (red arrow in the picture). This may indicate that there is something wrong with the lifetime of the Sink itself. Analysis of our customer source code revealed that this was, indeed, the case: the sink object, implemented in C++, was created with new and destroyed with delete. new was called immediately before handing a reference to the Connectable Object in IConnectionPoint::Advise(). In simplified code:
 Sink* pSink = new Sink();
CComPtr<IUnknown> pSinkUnk;
pSink->QueryInterface(__uuidof(IUnknown), (void**) &pSinkUnk);
hr = pUnk.CoCreateInstance(__uuidof(Button));
if (FAILED(hr))
    return hr;
DWORD dwCookie;
hr = AtlAdvise(pUnk, pSinkUnk, __uuidof(ButtonEvents), &dwCookie);
delete was called after the sink unregistered with the connection point by calling IConnectionPoint::Unadvise(). In simplified code:
 hr = AtlUnadvise(pUnk, __uuidof(ButtonEvents), dwCookie);
delete pSink;
Why COM Interoperability makes a difference
With reference to the last code snippet, when AtlUnadvise() is called (IConnectionPoint::Unadvise), the CLR deregisters the connection but the RCW does not release its reference to the sink. Since the Sink destroys itself at this stage, the RCW in the CLR is left with a pointer to a former COM object which is now released memory. When the CLR shuts down, or when GC takes place, the RCW tries to call Release() on the already-released sink.
At this point 2 things can happen:
1. The memory that was previously used by the sink is free. The attempt to call Release() on the sink generates an Access Violation but the CLR handles and ignores it (see Note above). Note that for heaps "freed" means reserved, uncommitted, memory, because the heap never releases reserved regions of memory.
2. The memory that was previously used by the sink is still allocated memory. This, in turn, can happen in 2 subcases:
2.a: because the memory was placed in the heap free list, ready for reuse, instead of being released. The free list is a functionality of a heap manager
2.b: because the memory has been reallocated for something else
The case of 100% CPU experienced by our customer is caused by case 2.a above: the call to Release() does not cause an access violation but it corrupts the structures of the free list in the heap manager. This causes the free list to create a circular reference, which causes an endless loop, hence 100% CPU, the next time the heap manager scans the list.
The case of access violation to which refers the second call stack is 1. above. They are just 2 different symptoms of the same problem. Note that the second symptom, unlike the first, allowed to find out the reason of the problem.
Fixing the Issue
With the findings above, fixing the issue is straightforward: the problem is caused by incorrect handling of the lifetime of a COM object, causing the CLR to access a piece of unmanaged memory that has already been released, therefore the fix consists in correctly handling the lifetime of COM objects by calling Release(). In simplified code:
 CComPtr<IUnknown> pUnk;
CComPtr<IUnknown> pSinkUnk;
CComObject<Sink>::CreateInstance(&pSinkUnk);
hr = pUnk.CoCreateInstance(__uuidof(Button));
if (FAILED(hr))
    return hr;
DWORD dwCookie;
hr = AtlAdvise(pUnk, pSinkUnk, __uuidof(ButtonEvents), &dwCookie);
...
...
hr = AtlUnadvise(pUnk, __uuidof(ButtonEvents), dwCookie);
pSinkUnk.Release();
Note
It may be argued that the CLR concurs to creating the issue by not releasing the sink reference when the sink calls Unadvise(). It is certainly true that this behavior concurs to the problem: if it called Release() on the sink in its implementation of IConnectionPoint::Advise(), the bad lifetime management of the sink would not surface, because by the time the sink deletes itself after calling IConnectionPoint::Advise(), there wouldn't be any outstanding references to it. However, the CLR behavior is not incorrect: once a client acquires a reference to a COM object, it can keep it at its own discretion. So there is nothing, in the CLR behavior, that violates the COM rules. Nondeterministic release of COM references is also consistent with the nondeterministic release of managed objects through Garbage Collection.
Comments
- Anonymous
June 25, 2009
I agree with your diagnosis of the problem, but your fix does not follow the usual COM conventions.Looking at the code, I'll assume that all of the CComPtr objects remain live for the entire program, so no automatic releases happen.CComPtr<IUnknown> pUnk;CComPtr<IUnknown> pSinkUnk;CComObject<Sink>::CreateInstance(&pSinkUnk);hr = pUnk.CoCreateInstance(__uuidof(Button));if (FAILED(hr)) return hr;-- at this point, this code is holding one reference count on the sink interface. The count was given by CreateInstance.DWORD dwCookie;hr = AtlAdvise(pUnk, pSinkUnk, __uuidof(ButtonEvents), &dwCookie);-- here there are 2 references to the sink. One held by this code and one created an held by the object that pUnk represents. Convention would be to release the reference this code holds right here (or allow the CComPtr to go aout of scope and release) and let the pUnk object determine the lifetime of the sink. Having this code continue to hold a reference may keep the sink alive too long and adds complexity to this calling code.......hr = AtlUnadvise(pUnk, __uuidof(ButtonEvents), dwCookie);pSinkUnk.Release();-- A complicating factor is that since the code being called is .Net, it won't release the sink interface when Unadvise is called. The managed object will have created an RCW for the sink. Unadvise will remove the reference to the sink RCW, but the actual interface will not be released until GC eventually, in its own good time, releases the RCW.This delayed release is a major problem with implementing COM objects in .Net. There are workarounds for this for a .Net object calling a COM object. But I'm now aware of a way to force timely release of a sink interface.I am quickly concluding that .Net is unusable for implementing COM object because of this problem. - Anonymous
July 06, 2009
The code snippet in the "Fixing the Issue" section, on which you commented, is part of a function (either main/WinMain or a function called by them), so the CComPtr<> instances go out of scope when the function returns, which causes the CComPtr<> destructor to Release() the contained interface pointer. No interface pointers are leaked.With respect to delayed release: the delayed release of RCWs is not, per se, causing the problem: it exposes the more fundamental problem that the lifetime of the pointed COM object is handled incorrectly (the COM object is created with new and released with delete, which violates the COM rules).If deterministic release is needed, Marshal.ReleaseComObject() can be used.Hope this helps. - Anonymous
February 23, 2010
"I am quickly concluding that .Net is unusable for implementing COM object because of this problem."I can't let that stand! :)The CLR absolutely sticks to the rules of COM as originally laid out. It only creates a problem for applications that don't follow the rules of COM.There is slight historical problem in that some of the core COM interfaces actually encourage implementers to break the rules of COM in their documentation.e.g. http://msdn.microsoft.com/en-us/library/aa768206%28VS.85%29.aspx - "All property loading must take place in the IPersistPropertyBag::Load function call, because the object cannot hold the IPropertyBag pointer."The MFC team took this to mean that they could write an IPropertyBag which ignored AddRef/Release, and they could allocate it on the stack. - Anonymous
October 22, 2013
We had a similar problem (same crash location in clr.dll!SafeRelease). However this one was correlated due an issue with the RCW. See blogs.msdn.com/b/vcblog/archive/2006/09/20/762884.aspx