Steps to Catch a Simple “Crash Dump” of a Crashing Process
Summary
When a user-mode process (such as w3wp.exe, owstimer.exe, iexplore.exe, or any .exe) is crashing (such that the process disappears unexpectedly from task manager and reappears soon after with a different PID number), arguably the best way to begin to determine the root cause of the crash is to catch a crash dump as that process is crashing. This blog offers two ways to trigger the crash dump and suggests a way to begin interpreting the dump.
The Choice between DebugDiag and WER
I highly recommend the use of DebugDiag as the tool to use to automatically trigger a crash dump as the process crashes and as the tool to begin analyzing the crash dump. The tool is simply the most flexible and customizable way to get simple crash dumps and advanced crash dumps. But since I'm taking here about simple crash dumps, and since it's not uncommon for the change management process to move too slowly, and since some IT groups have very restrictive tool installation approval process for their servers, sometimes DebugDiag cannot be installed on a server where a process is crashing, I also am going to offer steps here to use Windows Error Reporting (WER) to automatically trigger the crash dump. Often WER is adequate to get the crash dump. So I'll start with WER. But if you have permission to install DebugDiag on your server, feel free to skip the WER steps.
How to Set up WER for a Crash Dump
WER is already there! WER is already part of your operating system (in Win2008 and higher) and needs only to be configured. You'll need to add a registry key.
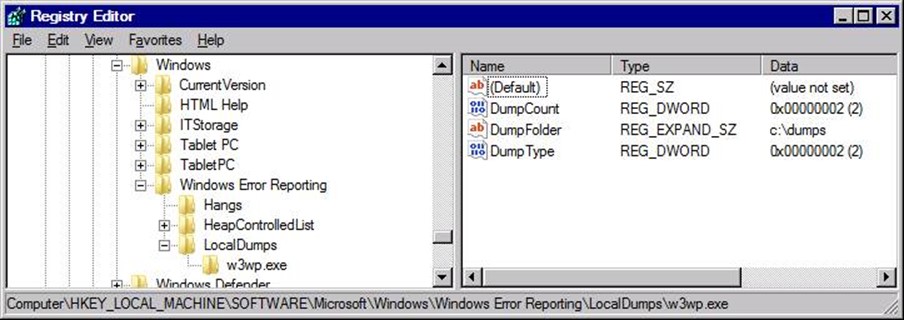
As an example, to catch a total of two crash dumps of a crashing w3wp.exe process, you could use copy the following text into notepad, save it, and rename it to something like W3wpcrashdumps-to-C.reg.
Windows Registry Editor Version 5.00
[HKEY_LOCAL_MACHINE\SOFTWARE\Microsoft\Windows\Windows Error Reporting\LocalDumps\w3wp.exe]
"DumpFolder"=hex(2):63,00,3a,00,5c,00,64,00,75,00,6d,00,70,00,73,00,00,00
"DumpCount"=dword:00000002
"DumpType"=dword:00000002
This will make a total of 2 full user dumps (not mini-dumps but full dumps) and write the dumps to C:\dumps.
In the registry it will look like this:
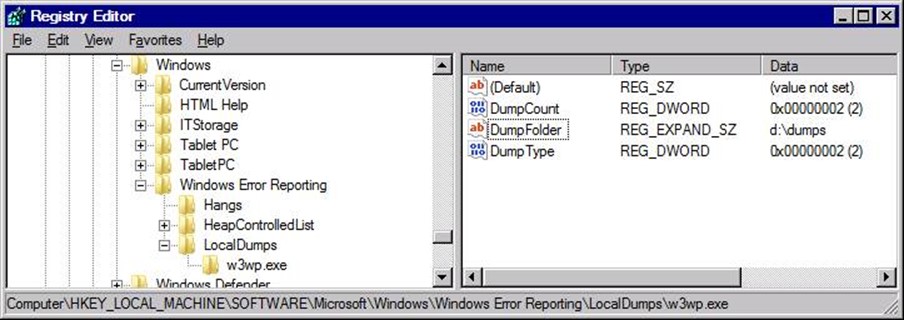
But you may not want to write the dumps to the system partition. You can send it to another drive with a few GB of free space instead.
So, as an example, to send the dumps to the D:\ drive you could use something like this:
Windows Registry Editor Version 5.00
[HKEY_LOCAL_MACHINE\SOFTWARE\Microsoft\Windows\Windows Error Reporting\LocalDumps\w3wp.exe]
"DumpFolder"=hex(2):64,00,3a,00,5c,00,64,00,75,00,6d,00,70,00,73,00,00,00
"DumpCount"=dword:00000002
"DumpType"=dword:00000002
In the registry it will look like this:
As long as this registry key is there, expect dumps to be written every time any w3wp.exe crashes—up to a maximum of two dumps if DumpCount is set to 2. So when you've collected enough dumps, don't forget to either delete the w3wp.exe key from the registry.
Of course if the crashing process is something other than a w3wp.exe, you'd want to create a different key under LocalDumps. For example, if OWSTimer.exe was crashing, you'd create a key for OWSTimer.exe.
References: https://msdn.microsoft.com/en-us/library/bb787181.aspx
INSTALL DEBUGDIAG
Assuming you did not configure WER with the steps above, install Debug Diagnostic 2.0 on the server suffering with a crashing process. Download it from https://debugdiag.com.
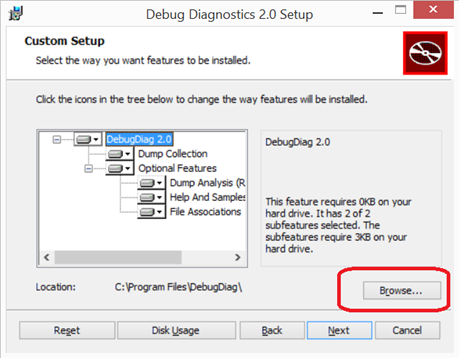
When you launch debugdiag.msi it will give you an option to change the default installation path. If you prefer to not install tools to the system partition, be sure to select the Browse button in the earliest phase of the wizard.
LAUNCH DEBUGDIAG
Launch Debug Diagnostics 2.0 Collection from the list of programs.
If UAE is enabled on the server, you may need to use the "Run as Administrator" option to avoid errors during launch.
SET UP A VERY BASIC CRASH RULE
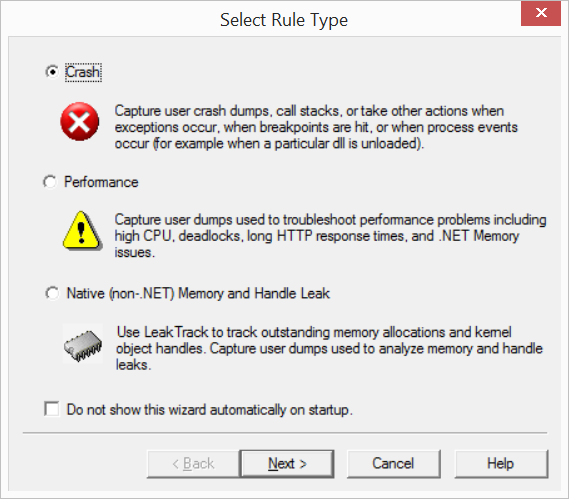
When asked which rule type to choose, keep the bullet beside "Crash" and click NEXT
For "Select Target Type" you have some great choices.
- If you need to get a dump of a process like owstimer.exe or iexplore.exe or anything not related to IIS, you should probably select "A specific process."
- If you have a w3wp.exe that is crashing and you know which Application Pool it is associated with, you should probably go with "A specific IIS web application pool."
- If you have a w3wp.exe that is crashing and you don't know which AppPool it is associated with, you should probably go with "All IIS/Com+ related processes."
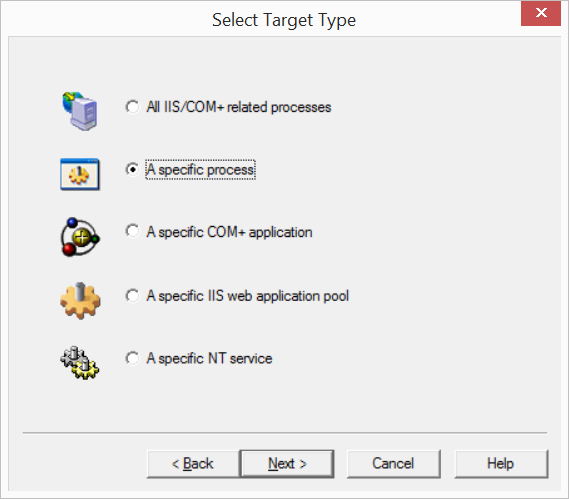
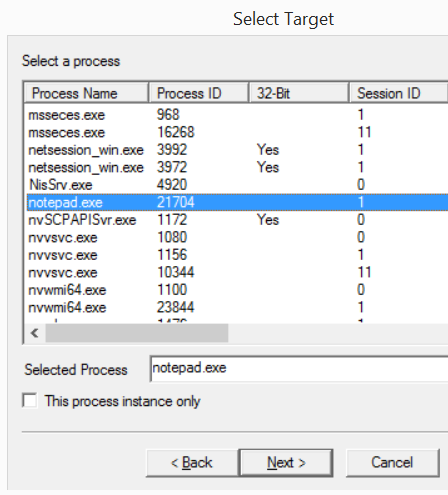
As an example, I'm selecting notepad.exe. It could be any other process.
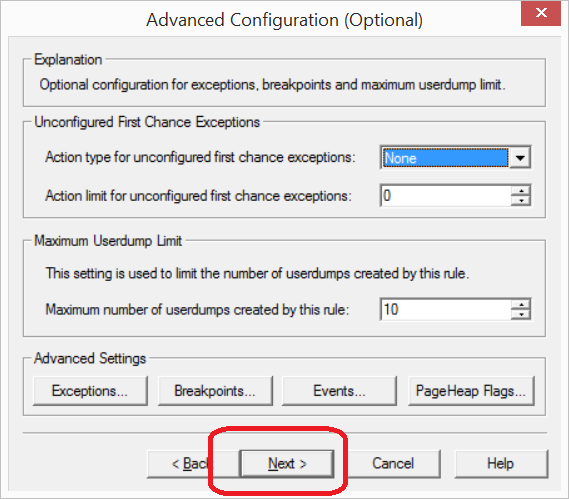
Leave everything set to the default setting in the Advanced Configuration for now. Just click NEXT.
Continue accepting the default settings and clicking next…
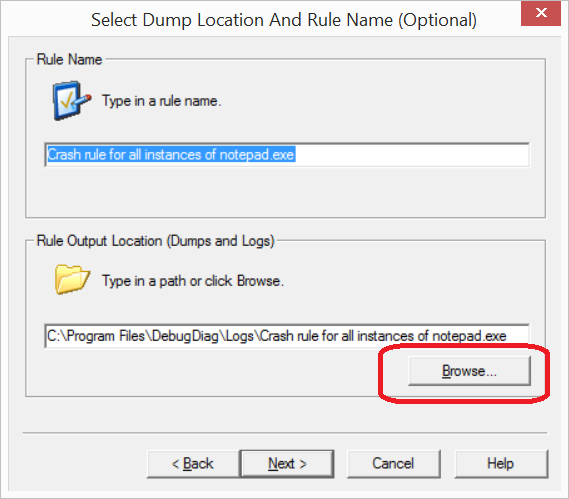
If you prefer that the .dmp files to be written to some place other than the default, select browse and guide it to another folder. Generally speaking it's probably good to not write the dumps to the system drive, especially if you have limited freespace.
Click Next.
Activate the rule when you're ready for the tool to start monitoring the process for a crash. . .
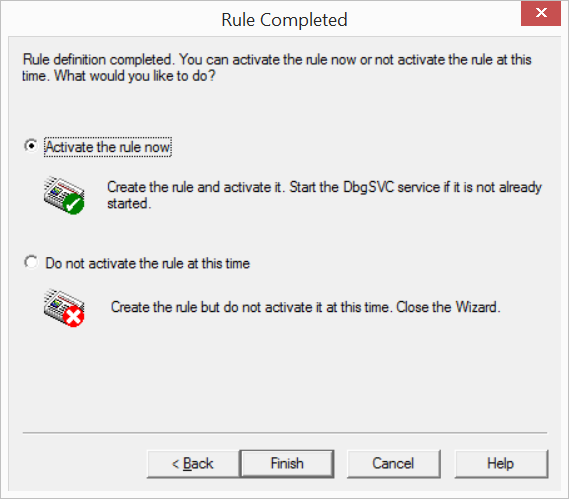
Just click YES here.
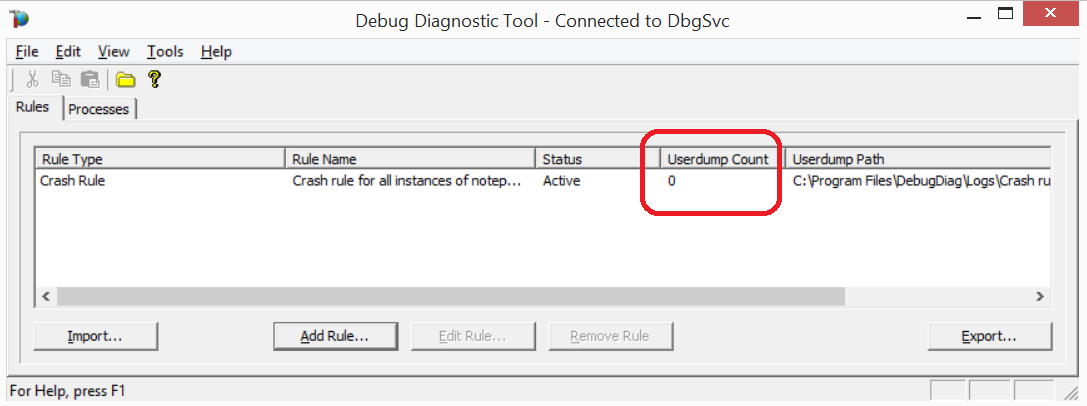
Note how the status is set to active and the userdump count is set to 0. The userdump count should increase when a crash is detected.
You can also activate and deactivate the crash rule from this view.
WAIT
Feel free to log off the server while waiting for the crash to occur. Since debugdiag runs as a service, you do not have to be logged into the machine.
This tool will monitor the process, watching and waiting for a crash to occur. When the process begins to crash, the debugger will interrupt the process temporarily, freeze that process, write out everything in that process to a .dmp file, and then allow the process to crash and restart.
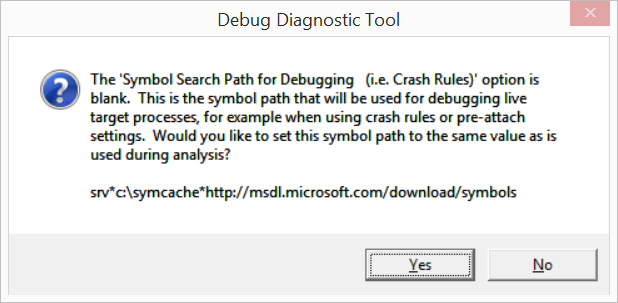
Preliminary Analysis of the Crash Dump
This step can be done from a server if (1) that server has outbound http access to the internet [specifically to Microsoft's public symbol servers] and (2) if you don't mind risking something that is fairly CPU intensive. It may make more sense to install Debug Diag 2.0 (or just the analysis piece) on a workstation that can access the internet and place the crash .dmp file on a share that it can reach.
Launch the Debug Diag Analysis program from the list of programs.
Place a checkmark beside CrashHangAnalysis. Don't select any other analysis rules.
Select "Add Data Files" and guide it to the crash dump.
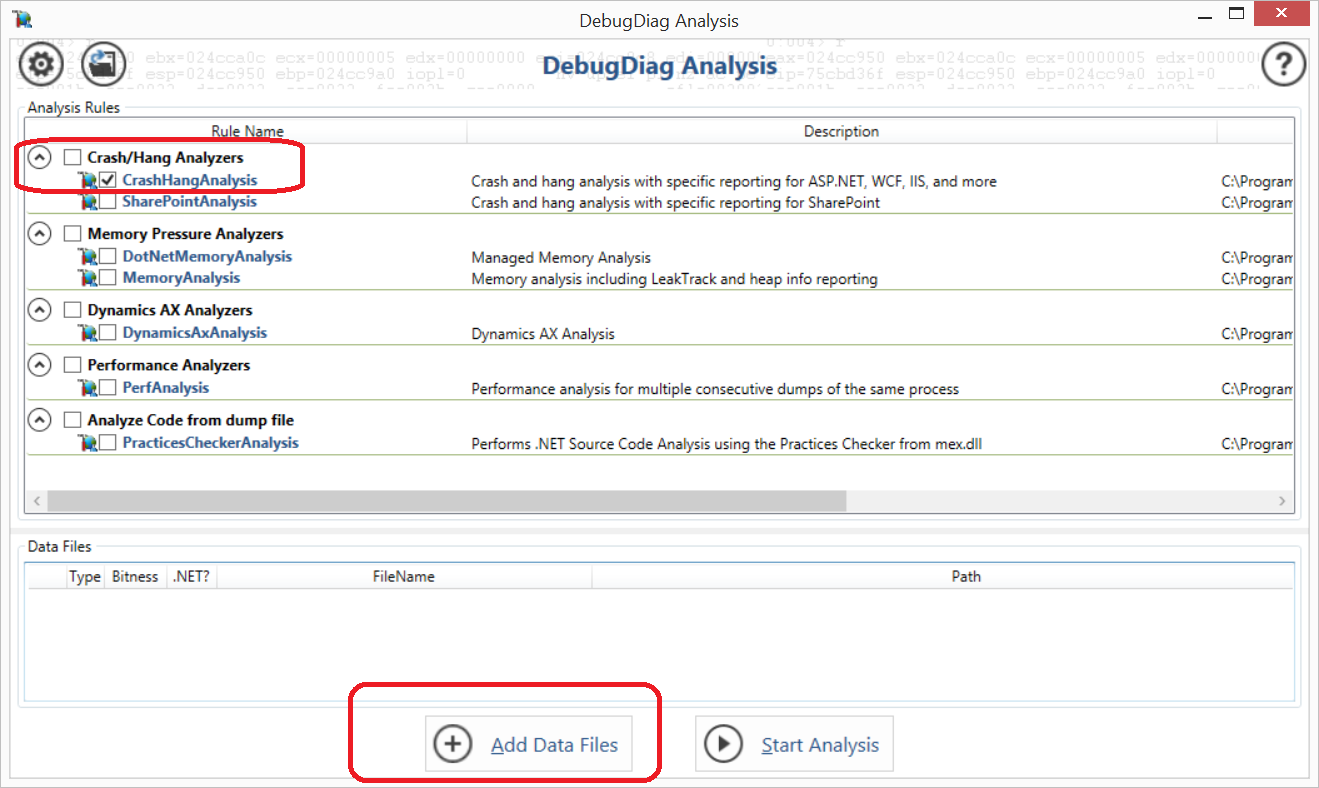
Select START ANALYSIS and wait for results to display.
Zipping the Dump
If you'd like to zip the dump file up in preparation to upload to an engineer at Microsoft, here is a good way to do it.
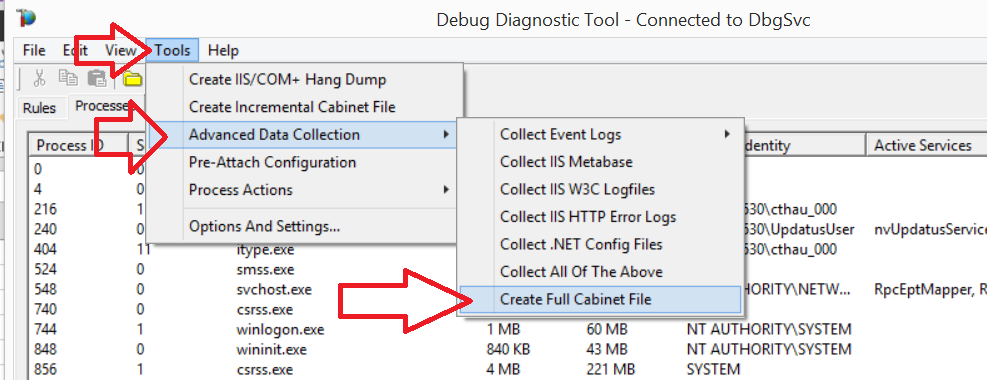
Expand the debugdiag Tools menu, select Advanced Data Collection, select Create Full Cabinet file. This should both collect and compress the event logs, the .net config files, the dump files, and more into one convenient .cab file.
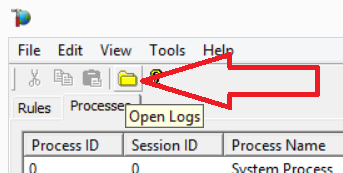
You can locate the .cab file by clicking the icon of the manila file folder.
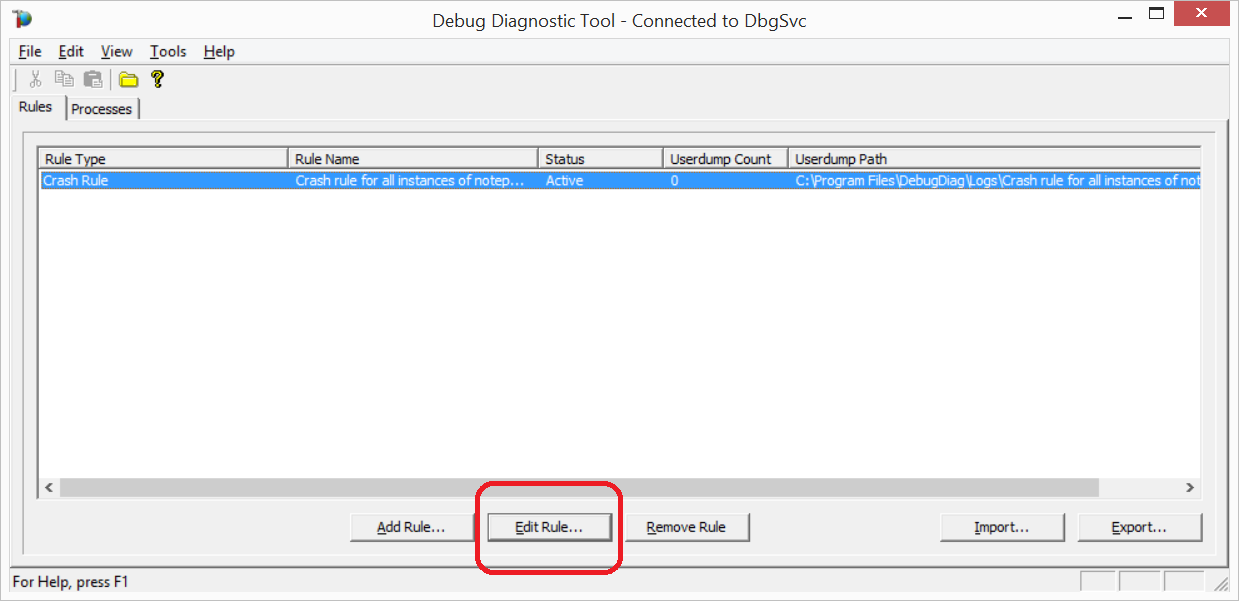
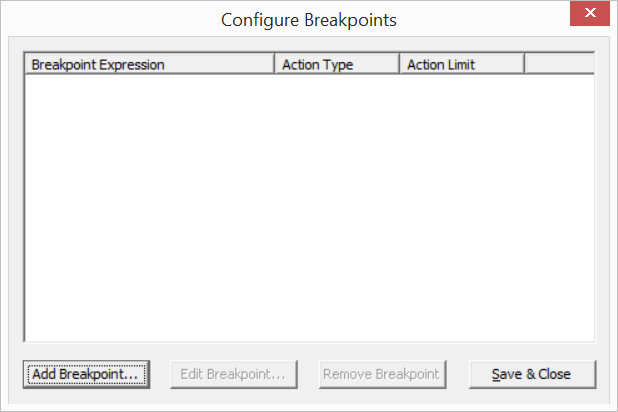
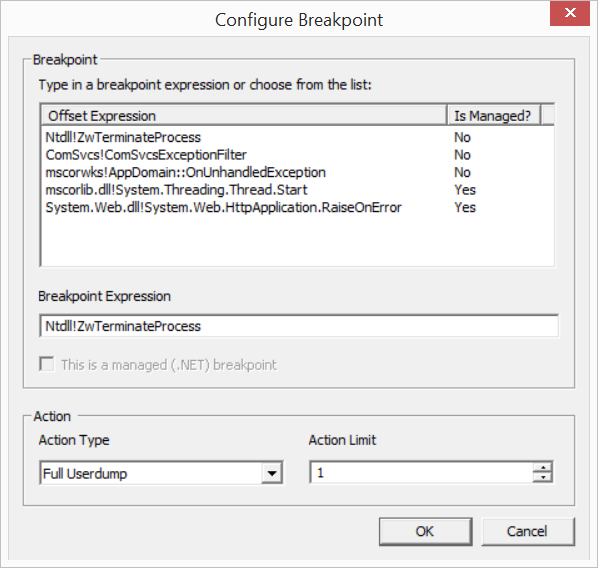
Making the Crash Rule More Sensitive
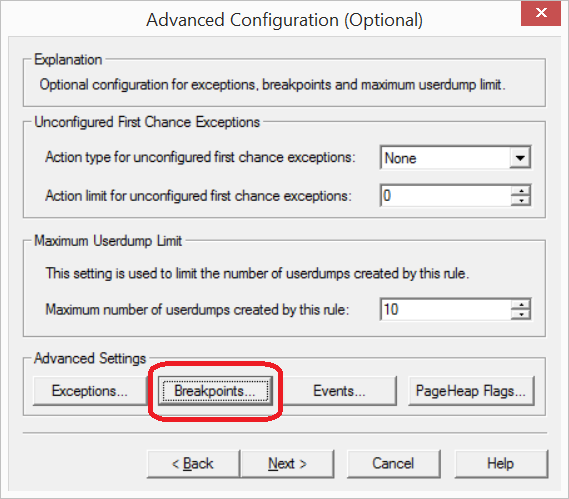
If this method above does not catch a crash and create a dump file when the crash occurs, you can edit the existing crash rule and add a breakpoint to make it more sensitive with the steps below.
Keep in mind, however, that this method may create a dump whenever a process is recycled or is otherwise gracefully shut down rather than when it actually crashes. So if, for example, you recycle your application pools at 2am every morning, and your crash rule creates a dump of the w3wp.exe at 2am, you might want to ignore and delete that dmp file.
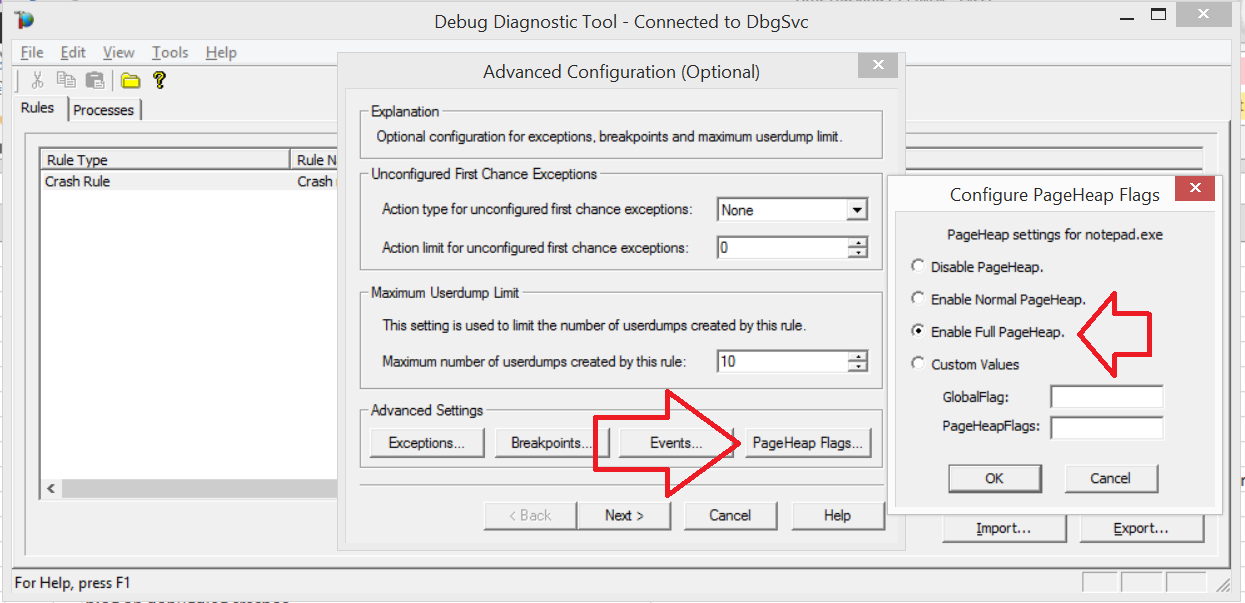
What if the dump shows heap corruption?
If the dump analysis shows signs of heap corruption as the cause of the crash, you might need to adjust your crash rule to enable gflags (as seen below) and wait for another crash. Gflags can only be enabled if during the creation of the crash rule you selected "specific process." Also enabling gflags can have a profound impact on server performance. This is some advanced work that is probably best done with the guidance of a support engineer at Microsoft. The debugging can be challenging and there is also a good chance that there may be need to switch to another tool (such as iDNA/TTTracer).
Additional search keywords
919789 How to use the Debug Diagnostics tool to troubleshoot an IIS process that stops unexpectedly
https://support.microsoft.com/default.aspx?scid=kb;EN-US;919789
921464 How to use the Debug Diagnostics 1.0 tool to analyze a memory dump file
https://support.microsoft.com/default.aspx?scid=kb;EN-US;921464
Event Source: W3SVC
Event ID: 1009
Description: A process serving application pool 'xyz' terminated unexpectedly. The process id was '1234'. The process exit code was '0xc0000005'.
Event Source: W3SVC
Event ID: 1011
Description: A process serving application pool 'xyz' suffered a fatal communication error with the World Wide Web Publishing Service. The process id was '1234'.
Event Source: Application Popup
Event ID: 26
Description: Application popup: inetinfo.exe - Application Error : The instruction at "0x01b2dc59" referenced memory at "0x00000008". The memory could not be "read". Click on OK to terminate the program
Source: Microsoft-Windows-WAS
Event ID: 5011
Description: A process serving application pool 'XYZ' suffered a fatal communication error with the Windows Process Activation Service. The process id was '2780'. The data field contains the error number.
Source: .NET Runtime
Event ID: 1027
Description: Application: w3wp.exe Framework Version: v4.0.30319
Description: The process was terminated due to stack overflow.
Event ID: 1000
Description: Faulting application w3wp.exe, version …, time stamp …., faulting module xyz.dll, version …., time stamp …., exception code ….., fault offset ….., process id …., application start time …..
Source: Microsoft-Windows-WAS
Event ID: 5009
Description: A process serving application pool 'XYZ' terminated unexpectedly. The process id was '1234'. The process exit code was 'l'.
Event Source: W3SVC
Event ID: 1011
Description: A process serving application pool 'XYZ' suffered a fatal communication error with the World Wide Web Publishing Service. The process id was '1234'. The data field contains the error number.
Event ID: 1000
Description: Faulting application w3wp.exe, version 7.0.6001.18000, time stamp 0x47919ed8, faulting module kernel32.dll, version 6.0.6001.18000, time stamp 0x4791ada5, exception code 0xe0434f4d, fault offset 0x000000000002649d, process id 0x1e90, application start time 0x01ca00762fbfb6f3.
Access violation
Second-chance exception
The SharePoint 2010 Timer service terminated unexpectedly. It has done this 696 time(s). The following corrective action will be taken in 30000 milliseconds: Restart the service. (Event ID: 7031, Source: Service Control Manager)
The SharePoint 2010 Timer service terminated with service-specific error %%-2147467259. (Event ID:7024, Source: Service Control Manager)
adplus.vbs –crash
"error while attaching to process via the DbgSvc service. ReloadControlScriptFailed. Could not open handle to control script shared memory mutex.")