Steps to Trigger a User Dump of a Process with DebugDiag when a Specific .net Exception is Thrown
[Update: These steps were written for DebugDiag 1.2 but can be readily adapted to DebugDiag 2.0. Download DebugDiag 2.0 from https://debugdiag.com!]
Usually after I've looked at logs created by my Steps to Log all .net Exceptions to a Log file with DebugDiag 1.2 or after I've seen a list of .net exceptions reported in a memory dump I often like to use DebugDiag 1.2 to trip a very surgical, precise memory dump when a very specific .net exception is thrown inside a process. The timing often impeccable. It's a bit like using an exception like a breakpoint.
Launch Debugdiag from the Programs Menu
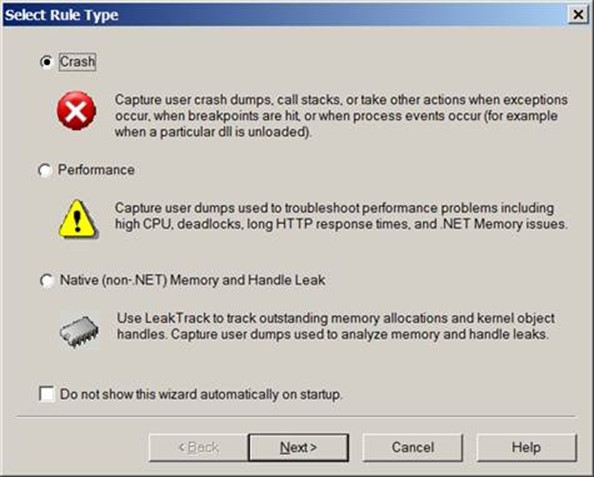
Select "Crash" as the rule type
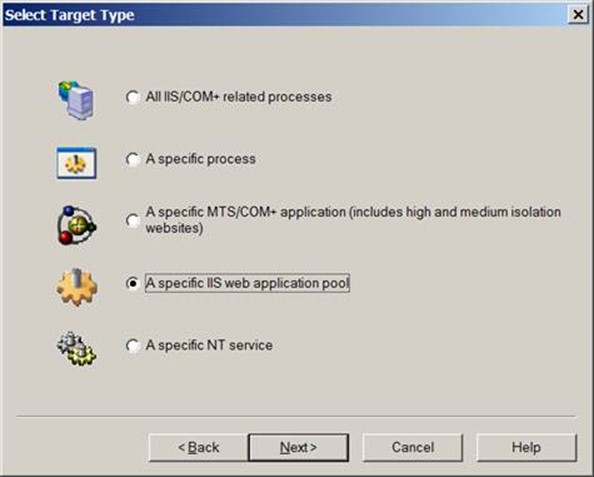
Assuming you're troubleshooting a problem that is occurring in an IIS/ASP.net process, try to select
"A Specific IIS Web Application Pool"
if you know which application pool to focus upon.
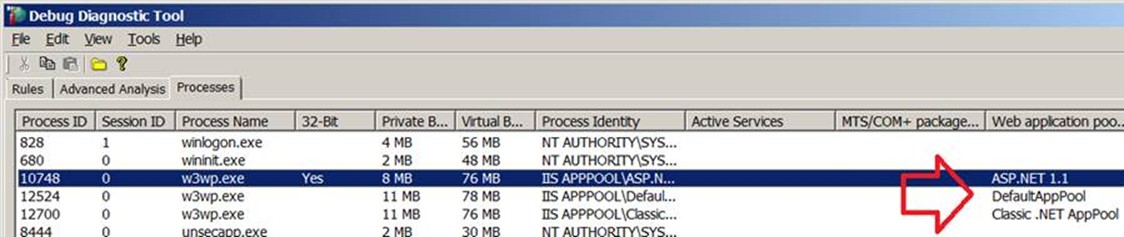
If you need to figure out which w3wp.exe matches which IIS Application Pool,
you can visit the processes tab of DebugDiag to get this information.
If you're not sure which IIS process to focus on, you can select
"All IIS/Com+ related processes."
If it's not an IIS process but another process throwing .net exceptions, you can select
"A specific process"
In this demo I'm selecting a specific AppPool and clicking Next.
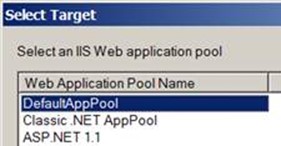
Select the AppPool to focus on and click Next again
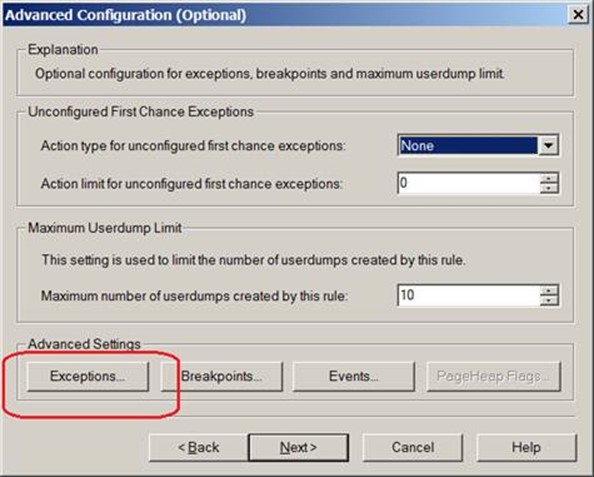
Select the Exceptions button
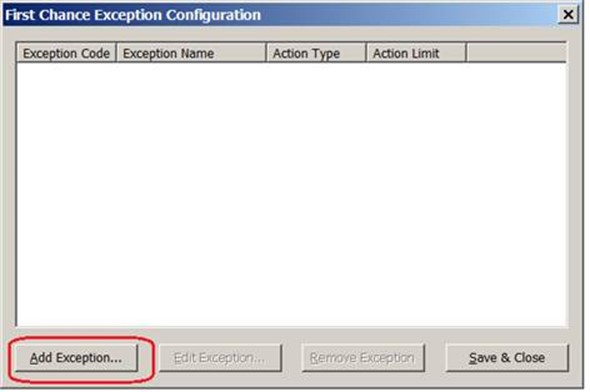
Select the Add Exception button
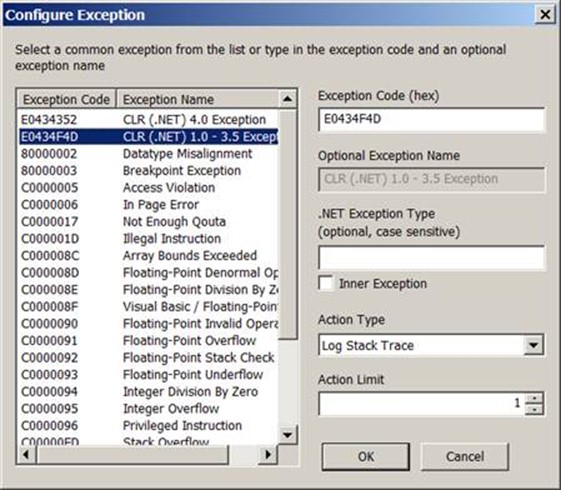
Highlight the Exception Code E0434F4D in the left pane if the web application we're troubleshooting is written in asp.net 1.0, 1.1, 2.0, 3.0, or 3.5. (If it's ASP.net 4.0, select the E0434352 code.)
Set Action Type to: Full Userdump
Set Action Limit to: 1 or 2.
If you can reproduce the problem quickly with one or two mouse clicks, 1 should be fine.
If you have to let this rule monitor the process for hours before your problem is reproduced, you might want to set the action limit higher in case there are "false positives" that occur.
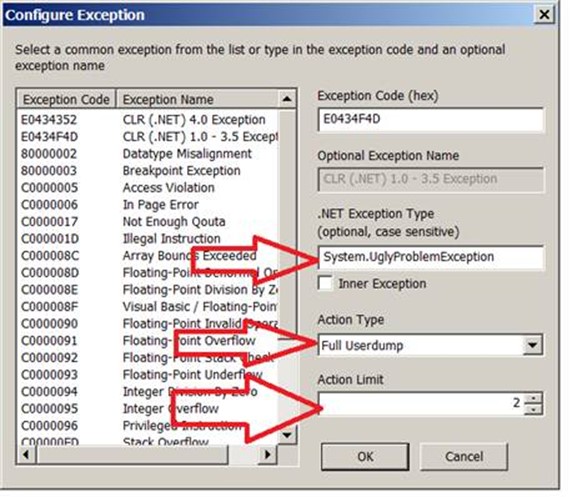
In the .NET Exception Type field type in the specific exception you're troubleshooting.
If you leave it blank, you'll get dumps for any and every .net exception
If you mistype it or don't pay attention to case sensitivity you may never get the dump. (Because the exception its monitoring for is never thrown.)
The exception should be typed System.Whatever (two levels deep) or even System.Whatever.Whatever (three levels deep).
Examples of exceptions:
System.InvalidCastException
System.OutOfMemoryException
System.IO.FileNotFoundException
System.NullReferenceException
System.CannotUnloadAppDomain
System.Threading.SynchronizationLock
System.InvalidOperationException
System.OverflowException
System.Data.SqlClient.SqlExeption
System.Data.VersionNotFoundException
System.ArgumentException
System.ExecutionEngineException
System.ArgumentOutOfRangeException
System.IndexOutOfRangeException
System.Net.WebException
System.Security.SecurityException
System.ServiceModel.EndpointNotFoundException
Click OK
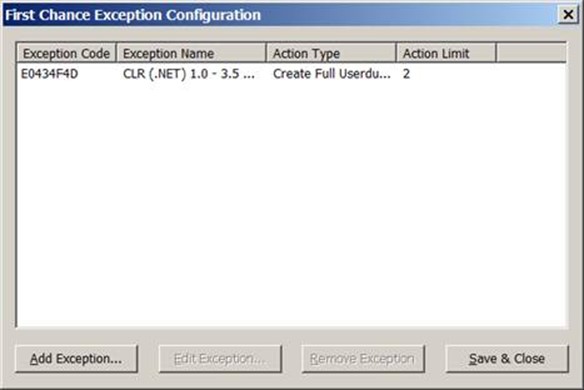
Click the "Save and Close" button.
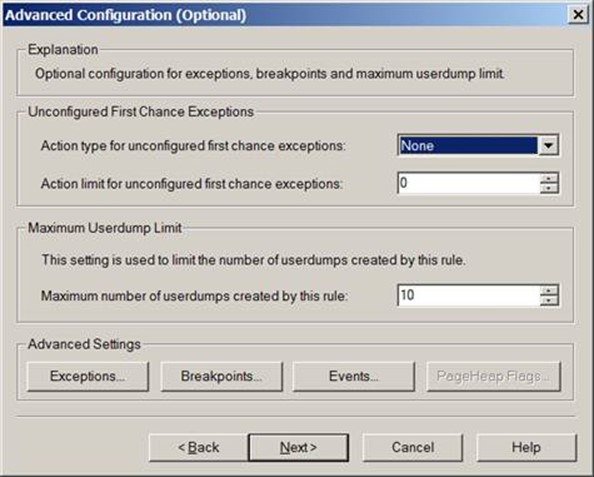
On the Advanced Configuration (Optional) window, simply click NEXT.
There is no need to make changes here.
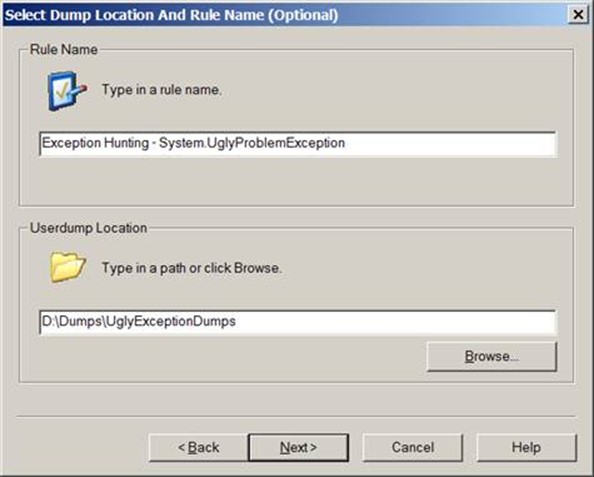
On the Select Dump Location and Rule Name window, feel free to change the rule name and the userdump location.
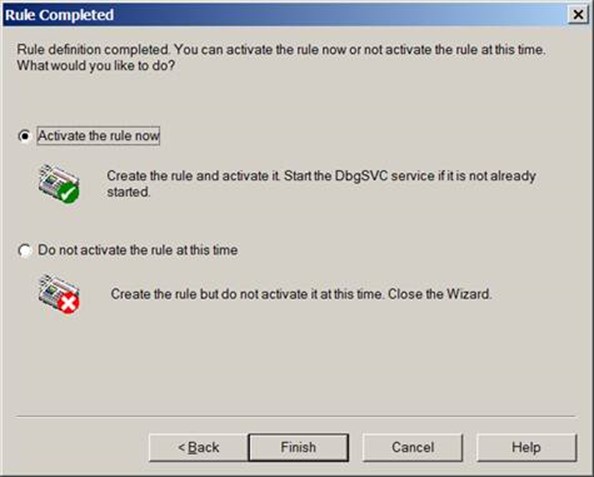
On the Rule Completed window, you have a choice on whether you're ready to activate the rule or not.
If you're ready to reproduce the problem (one or two mouse clicks away) then activate it now.
Otherwise select "Do not activate the rule at this time" for now and activate it later.
Click Finish.
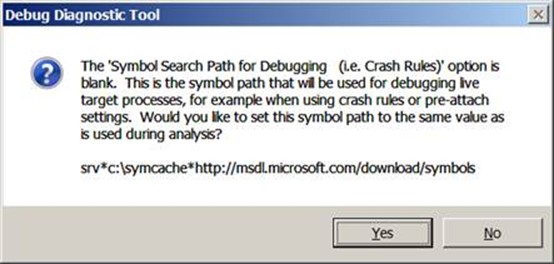
If you see this message about Symbol Paths, you can select YES.
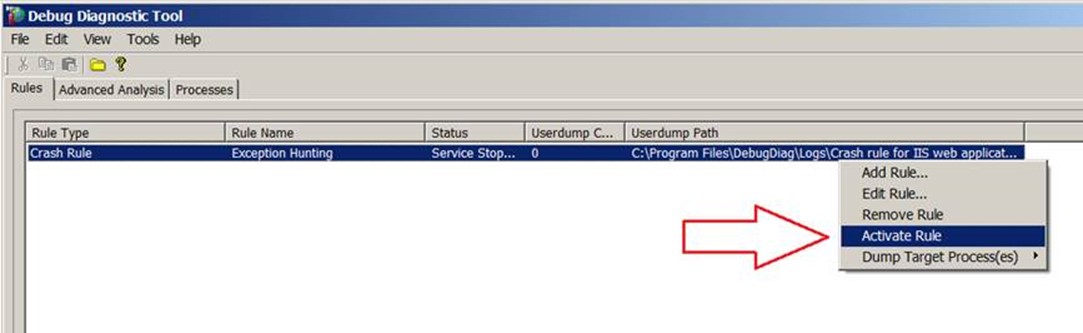
Assuming the rule was not activated upon rule finish, you can activate the rule when you are ready to reproduce the problem.
If possible, activate the rule when you are one or two mouse clicks away from reproducing the problem.
Also, if possible, reproduce the problem in a test environment rather than in a production environment.
If you do reproduce the problem while logging exceptions with debugdiag, try to reproduce the problem when traffic to the application pool or process that you're monitoring is at its lowest levels.
Whenever a CLR/.Net exception is thrown inside of the selected process, debugdiag should create a memory dump of the process being monitored when that exception is thrown.