Note
Access to this page requires authorization. You can try signing in or changing directories.
Access to this page requires authorization. You can try changing directories.
If you've seen a dotted line in a performance view, similar to the one in the graph below, that means that performance data has not been collected during that period of time. This can be a tricky issue to troubleshoot since there are many factors involved in performance collection. The goal of this post is to provide you with the some of the steps necessary to track this issue down.
(Sample performance graph showing a gap in monitoring data)

The first thing you’ll want to do in order to troubleshoot this issue is check other performance counters for the agent and see if they also have missing data points during the same time range. If they do, then this likely indicates a functional problem with the Microsoft Monitoring Agent (aka HealthService), however, it could also indicate a problem with the management server to which this agent reports.
To look further into this scenario, check to see if you had any Heartbeat Failures for the agent(s) around the time of the missing data. You can do this by creating a new Alert View with the following properties:

In the Look For box (click Find if the Look for box isn’t present) type the name of the agent which is missing data. If any alerts are returned, look at the Created time to see if it fits within the time period. If it does, follow the steps outlined in https://support.microsoft.com/en-us/kb/2288515 to troubleshoot the gray agent state.
Another thing to look at would be if multiple agents have missing data at the same time. If they do, then check to see if those agents report to the same management server. It could be that the management server had an issue writing data to the database during that time frame. Look in the Operations Manager log on the management server during the time frame and see if there are any events indicating a connection or write failure to the OperationsManager database. One such event is a 2115:
Event Type: Warning
Event Source: HealthService
Event ID: 2115
Description:
A Bind Data Source in Management Group %1 has posted items to the workflow, but has not received a response in 300 seconds. This indicates a performance or functional problem with the workflow.
Workflow Id : Microsoft.SystemCenter.CollectPerformanceData
Instance : %2
Instance Id : %3
To troubleshoot 2115 events, refer to https://blogs.technet.com/b/momteam/archive/2012/04/17/kb-how-to-troubleshoot-event-id-2115-in-operations-manager.aspx
If only one performance counter for one agent has missing data, then it’s probably just an issue with that one workflow. To find out, check the Operations Manager event logs on the agent. When checking the event log, create a filter to look for events during the time range on which the gap occurred.
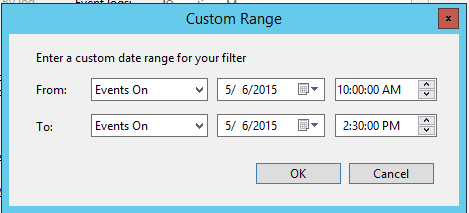
For instance, in the graph above the gap occurred between 11am and 2:30pm on 5/6. To create the event log filter to look at this time range:
- Open eventvwr and navigate to Applications and Services -> Operations Manager
- Under the Actions pane on the right-hand side, click Filter Current Log
- Under the Filter tab, click the drop down next to Logged: and choose custom range
- Change the date range to an hour before the gap occurred to the time that the next data point was collected. It should look similar to this:
Now that the event log is filtered to our time range, we want to make note of any events that may indicate a functional problem with the Microsoft Monitoring Agent or with the specific workflow which is responsible for collecting the missing data. Some events to look for are:
- HealthService 4506:
Event Type: Error
Event Source: HealthService
Event ID: 4506
Event Description:
Data was dropped due to too much outstanding data in rule "%2" running for instance "%3" with id:"%4" in management group "%1".
If this event is occurring, it is most likely due to performance issues on the server. It could be due to high processor utilization, low memory or poor disk performance on the drive that hosts the HealthServiceStore.mdb file. You could use the built-in performance views in Operations Manager or perfmon.msc to diagnose any of these issues. Some counters you would want to look at are:
-
- Processor Information\%Processor Time\_Total
- Memory\Available Mbytes
- LogicalDisk\Avg. Disk Sec/Transfer\X: (where X: is the drive that the HealthServiceStore.edb file is stored on)
- HealthService 1103:
Event Type: Warning
Event Source: HealthService
Event ID: 1103
Description:
Summary: 1 rule(s)/monitor(s) failed and got unloaded, 1 of them reached the failure limit that prevents automatic reload. Management group %1. This is summary only event, please see other events with descriptions of unloaded rule(s)/monitor(s).
If you see an 1103 event, there should be an accompanying warning or error event that occurs just before it in the log that indicates the workflow which failed and the reason.
- HealthService 4000
Event Type: Error
Event Source: HealthService
Event ID: 4000
Description:
A monitoring host is unresponsive or has crashed. The status code for the host failure was %1.
This error indicates that the process responsible for running workflows (MonitoringHost.exe) has crashed. If you’re seeing this error often, I’d recommend contacting Microsoft Support to further troubleshoot the issue.
I hope this has helped you identify the reason for the gaps in performance data. Stay tuned as I'll dive deeper into this issue in my next article and go over setting up custom SCOM ETL traces to identify failures in workflows collecting performance data.