Note
Access to this page requires authorization. You can try signing in or changing directories.
Access to this page requires authorization. You can try changing directories.
Microsoft Japan Data Platform Tech Sales Team
森本 信次
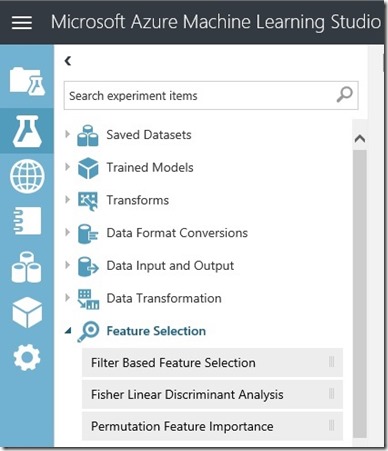
Azure ML でも 図1のように、3つの Feature Selecction ( 特徴選択 ) が使えるのですが、この 「Feature Elimination」については 今のところ対応していませんので、今回の投稿では Juypter Notebook および Python のライブラリを使ってこの特徴選択の手法を試してみいたと思います。
ウィキペディア によると、特徴選択(とくちょうせんたく、英: feature selection)とは、機械学習と統計学の用語であり、頑健な学習モデルの構築のため、特徴集合のうち意味のある部分集合だけを選択する手法のことを指します。詳しくはこちらをご覧ください。
1. Filter Based Feature Selection
2. Fisher Linear Discriminant Analysis
3. Permulation Feature Importance
図1. Azure Machine Learning Studio の Feature Selection Items
Read Data ( データの読み込み )
このサンプルではボストンの住宅に関するデータセットを使用します。データセットには 506 件のデータが含まれ、13種類の説明変数 ( 部屋の数、築年数、町の犯罪率 など ) があります。データセットの詳しい説明はこちらをご覧ください。
| from sklearn.datasets import load_bostonboston = load_boston()X = boston.datay = boston.targetfeature_names = boston.feature_namesprint(X.shape)print(y.shape)print(feature_names) |
上記のコードの実行結果です。
| (506, 13)(506,)['CRIM' 'ZN' 'INDUS' 'CHAS' 'NOX' 'RM' 'AGE' 'DIS' 'RAD' 'TAX' 'PTRATIO' 'B' 'LSTAT'] |
Recursive Feature Elimination ( 再帰的特徴選択 )
Python の sklearn パッケージ にはいくつかの 特徴選択のメソッドが含まれています。このサンプルではこのパッケージの 「Recursive Feature Elimination」 メソッドを使うことにします。このプロセスではすべての変数に対して重みづけを行い、重みが小さいものから取り除いていきます。残りの変数はモデルの再フィットおよびこのプロセスを繰り返すのに使用します。skleann 詳細についてはこちらをご覧ください。
まず必要となるパッケージをインポートするところから始めましょう。
| %matplotlib inlineimport matplotlib.pyplot as pltimport pandas as pdimport numpy as npfrom sklearn.linear_model import LinearRegressionfrom sklearn import preprocessingfrom sklearn.feature_selection import RFECV |
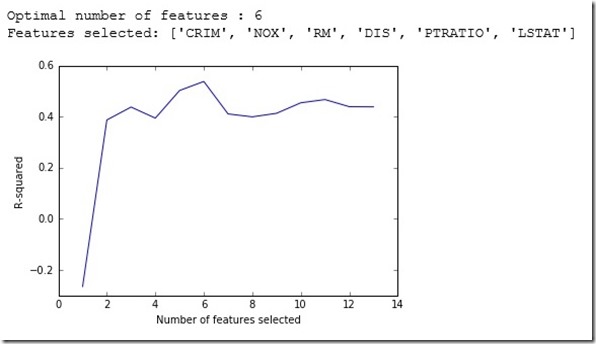
以下のコードでは最初に特徴をスケールさせて、「Recursive Featrue Elimination」 メソッドにより どの特徴を使用するかを選択しています。
# initiate the linear modellm = LinearRegression() # scale the featuresmin_max_scaler = preprocessing.MinMaxScaler()x_scaled_minmax = min_max_scaler.fit_transform(X)x_scaled_minmax_df = pd.DataFrame(x_scaled_minmax, columns = feature_names) # recursive feature elimination with cross validation, using r-squared as metricrfecv = RFECV(estimator=lm, step=1, cv=5, scoring='r2')rfecv.fit(x_scaled_minmax_df, y) # print the optimal number of feature (最適な特徴の数)print("Optimal number of features : %d" % rfecv.n_features_) # save the selected features (選択された特徴)feature_cols_selected = list(np.array(feature_names)[rfecv.support_])print("Features selected: " + str(feature_cols_selected)) # plot number of features VS. cross-validation scoresplt.figure()plt.xlabel("Number of features selected")plt.ylabel("R-squared")plt.plot(range(1, len(rfecv.grid_scores_) + 1), rfecv.grid_scores_)plt.show() |
このように含めるべき特徴 ( 今回のケースでは 6 種類 )を特定できたので、次にモデルのフィッティングを行います。上記の RFE ( Recursive Feature Elimination )ステップではスケールさせた特徴を使いましたが、今回のモデルのフィッティングはオリジナルの値を使うことにします。この方法では予測を行うときにデータを変換する必要がありません。
#%% fit model with selected featuresX_new = X[:,rfecv.support_]lm2 = LinearRegression()lm2.fit(X_new, y) # print the R-squaredprint("The R-squared value is: {0:0.4f} \n".format(lm2.score(X_new, y)))# save intercept and coefficientsparam_df = pd.DataFrame({"Features": ['intercept'] + feature_cols_selected, "Coef": [lm2.intercept_] + list(lm2.coef_)})cols = param_df.columns.tolist()cols = cols[-1:]+cols[:-1]param_df = param_df[cols]print(param_df) |
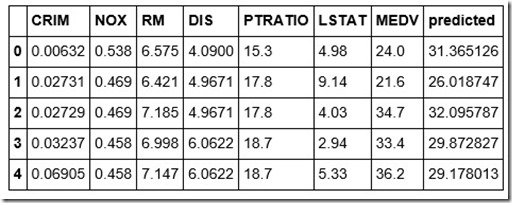
次に予測を行うためモデルを使ってみましょう、通常は適切なデータセットに基づいて予測を行うべきですが、今回は解説を目的としているため簡易的なデータセットを使用しています。
# assign test datanewX = X_newnewY = y # make predictionspredicted = lm2.predict(newX)predictedDf = pd.DataFrame({"predicted": predicted}) # dataframe for XnewXDf = pd.DataFrame(newX)newXDf.columns = feature_cols_selected# dataframe for ynewYDf = pd.DataFrame(newY)newYDf.columns = ['MEDV']# join X, y and predictionmydata_with_pd = newXDf.join(newYDf).join(predictedDf)mydata_with_pd.head() |
# check performance metricsimport numpy as npobs = mydata_with_pd.MEDVpred = mydata_with_pd.predicted mae = np.mean(abs(pred-obs))rmse = np.sqrt(np.mean((pred-obs)**2))rae = np.mean(abs(pred-obs))/np.mean(abs(obs-np.mean(obs)))rse = np.mean((pred-obs)**2)/np.mean((obs-np.mean(obs))**2) print("Mean Absolute Error: {0:0.6f}".format(mae))print("Root Mean Squared Error: {0:0.6f}".format(rmse))print("Relative Absolute Error: {0:0.6f}".format(rae))print("Relative Squared Error: {0:0.6f}".format(rse)) |
| Mean Absolute Error: 3.467774Root Mean Squared Error: 4.936601Relative Absolute Error: 0.521689Relative Squared Error: 0.288678 |
Web サービスのセットアップ
モデルの開発後には、そのモデルを Web サービスとしてデプロイすることで、他からそのモデルを使用できるようになります。以下では Webサービスのデプロイをサポートする 「azureml」 パッケージを Notebook 環境へインポートして、「demoserviceVarSel」 という名前の Web サービスをセットアップしています。
# extract workspace infofrom azureml import Workspacews = Workspace()workdspace_id = ws.workspace_idauthorization_token = ws.authorization_token # set up web servicefrom azureml import services@services.publish(workdspace_id, authorization_token)@services.types(crim = float, nox=float, rm=float, dis=float, ptratio=float, lstat=float)@services.returns(float)def demoserviceVarSel(crim, nox, rm, dis, ptratio, lstat): feature_vector = [crim, nox, rm, dis, ptratio, lstat] return lm2.predict(feature_vector) |
| service_url = demoserviceVarSel.service.url api_key = demoserviceVarSel.service.api_keyhelp_url = demoserviceVarSel.service.help_urlservice_id = demoserviceVarSel.service.service_id |
Webサービスの使用
以下のコードの目的は Web サービスがデプロイされて使用可能になるまで数秒待つことです。
| # wait import timetime.sleep(10) |
以下のコードでは Web サービスを使用するためのものです。
import urllib2# If you are using Python 3+, import urllib instead of urllib2 import json data = { "Inputs": { "input1": { "ColumnNames": ["crim", "lstat", "nox", "rm", "ptratio", "dis"], "Values": [ [ "0.00632", "4.98", "0.538", "6.575", "15.3", "4.0900" ], [ "0.02731", "9.14", "0.469", "6.421", "17.8", "4.9671" ], ] }, }, "GlobalParameters": {} } body = str.encode(json.dumps(data)) url = service_urlapi_key = api_key # Replace this with the API key for the web service headers = {'Content-Type':'application/json', 'Authorization':('Bearer '+ api_key)} req = urllib2.Request(url, body, headers) try: response = urllib2.urlopen(req) # If you are using Python 3+, replace urllib2 with urllib.request in the above code: # req = urllib.request.Request(url, body, headers) # response = urllib.request.urlopen(req) result = response.read() print(result) except urllib2.HTTPError, error: print("The request failed with status code: " + str(error.code)) # Print the headers - they include the requert ID and the timestamp, which are useful for debugging the failure print(error.info()) print(json.loads(error.read())) |
予測結果です。
| {"Results":{"output1":{"type":"table","value":{"Values":[["31.3651262005007"],["26.018746711909"]]}},"output2":{"type":"table","value":{"Values":[["data:text/plain,Execution OK\r\n",null]]}}}} |
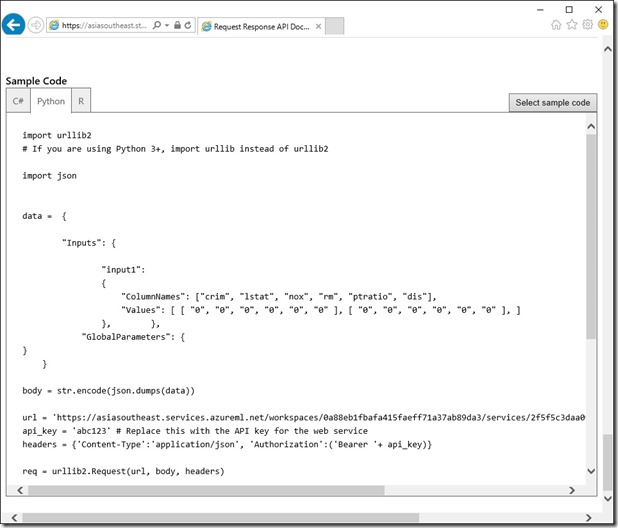
上記の Web サービスを使用するコードは help_url に基づいており、今回使用した言語 Python 以外にも C# や R を使った場合の Web サービス使用のサンプルコードを確認することができます。help_url をブラウザーから開き “Python” タブ の “Sample Code” にサンプルコードが掲載されています。
まとめ
いかがでしたでしょうか ? ここまでで Jupyter Notebook を使用した 特徴選択の手法の一つである 「Featuer Elimination」 を Azure ML の Juypter Notebook 環境で使う場合の一連の流れを見ていただきました。Azure Machine Learning Studio には他にも 解説付きのNotebookが提供されいますので、是非お試しいただければと思います。


