Note
Access to this page requires authorization. You can try signing in or changing directories.
Access to this page requires authorization. You can try changing directories.
What is a dump and how is it useful?
A dump is a snapshot of an application at the point in time the dump is taken. It shows what was executing, what modules are loaded, and if saved with heap contains a snapshot of what was in the application’s memory at that point in time making a dump with heap potentially more useful for diagnosing an issue (dumps with heap do however have the disadvantage of being much larger files making them harder to upload/email). Dumps are primarily used for debugging issues that occur only machines the developer does not have access to (e.g. a crash occurs when running on a customer’s computer, but does not occur on the developer’s computer). Dumps are not only useful for crashes, another common example is capturing a dump of an application that is hung.
How to create a dump
TIP: If you are looking to create a dump of Visual Studio to report an issue to Microsoft, you can create the dump and log an issue and upload the dump to Microsoft all at the same time using the Send Feedback feature in Visual Studio
There are many tools for creating dumps, the easiest method is using the Task Manager on Windows Vista and up (this has significant drawbacks in many cases however as I will explain below), followed by Windows Systinternals ProcDump (free from Microsoft) but since this is a Visual Studio Debugger blog, I will also show how to use Visual Studio to collect a dump.
A dump is ultimately created by Windows regardless of the tool used to create it, so “a dump is a dump” regardless of what tool is used (there is one exception to this when using Task Manger on a 64bit operating system to create a dump of a 32bit process--explained in the “Creating a dump using Task Manager” section).
Since ProcDump is the most configurable tool for collecting dumps, and is relatively easy to obtain and use, I will explain how to collect dumps with ProcDump first.
Creating a dump using ProcDump
ProcDump is a command line tool for collecting dumps that is freely available from Microsoft. Applications can either be launched with ProcDump (very useful if the application is crashing on startup), or attached to with ProcDump. Additionally ProcDump can immediately collect a dump in the case of attaching to a process, or be configured to collect a dump when a variety of conditions are met (the application crashes, hangs, uses too much CPU/memory, etc). The full description and functionality are documented on the Systinternals ProcDump page
Collecting a dump with ProcDump
- Download procdump.zip from https://technet.microsoft.com/en-us/sysinternals/dd996900.aspx
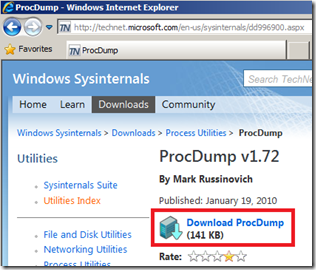
- Unzip procdump.zip
- From a command prompt, navigate to the folder where you unzipped procdump
- Launch procdump.exe with the appropriate arguments for your scenario. Below I list a few of the most common arguments, however a full list is available on the ProcDump page):
-e Write a dump when the process encounters an unhandled exception.
-h Write dump if process has a hung window (does not respond to window messages for at least 5 seconds).
-ma Write a dump file with all process memory. The default dump format includes thread and handle information.
-x Launch the specified application
-g Run as a native debugger in a managed process (required for collecting dumps from processes running .NET code)
Examples of collecting a dump with ProcDump
Launch an application with ProcDump and collect a dump with heap when the process crashes:
C:\>procdump –e –ma –x -g crash.dmp C:\Dumps “C:\My Applications\CrashingApp.exe”
Attach to an application that is hung and collect a dump with heap immediately:
C:\>procdump –ma HangingApplication.exe hang.dmp
Launch an application with ProcDump and collect a dump with heap when process either crashes or hangs
C:\procdump –e –h –ma -g –x C:\Dumps “C:\My Applications\Application1.exe”
Example of attaching to Visual Studio using ProcDump to collect a dump on an unhandled exception 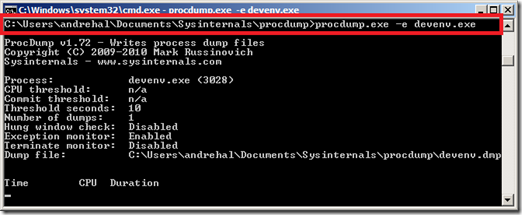
Creating a dump using Visual Studio
- Open Visual Studio
- Select “Tools->Attach to Process”

- Click the “Select…” button for “Attach to:”
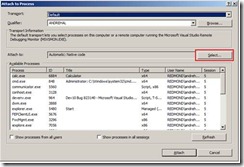
- Select “Debug these code types:”
- Select “Native” (Note: Native is used because in versions of Visual Studio prior to 2010 the option to save a dump is not available with the managed engine. Since the dump is created by windows, it does not matter which debug engine is attached to the application)
- Click OK on the “Select Code Type” dialogue
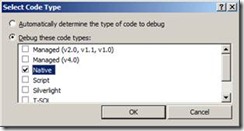
- Click “Attach”
- Depending on if you want to create:
- A crash dump:
- A non-crash dump (e.g. a hung process)
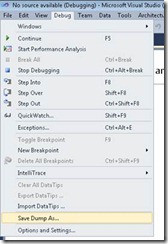
- On the Debug menu, select “Save Dump As…”
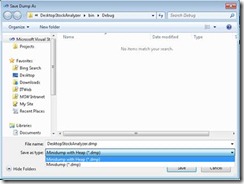
- Choose where to save the dump file, and whether you want a dump “with heap” or “without heap” (In Visual Studio 2008 the default is “without heap”, in Visual Studio 2010 the default is “with heap”)
Beginning in Windows Vista, the Windows Task Manager includes support for creating dump files. This can be very useful, and is slightly quicker and less complicated than creating a dump using ProcDump or Visual Studio; there are however a few things to note when using Task Manager to create dumps.
- Task Manager always creates a dump with heap
- If the application has crashed, Task Manager does not include the exception information in the dump
- On a 64bit operating system, dumps taken with Task Manager of 32bit processes cannot be debugged with versions of Visual Studio prior to 2013 because Task Manager saves the dump as a 64bit dump of the 32bit process (for a 64bit dump of a 32bit process either windbg or Visual Studio 2013 must be used).
To create a dump using Task Manager:
- Open the “Windows Task Manager”
- Select the “Processes” tab
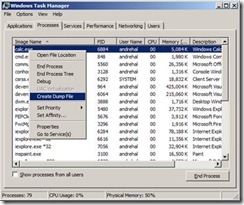
- Right click the process you wish to take a dump of
- Select “Create Dump File”
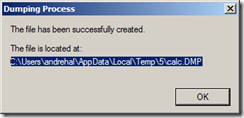
- A dialogue will appear with the location of the saved dump (The file location can be selected and then copied and pasted).
Frequently Asked Questions Regarding Dumps:
Q: Can Visual Studio debug dumps of applications written in managed code?
A: Yes (kind of), support was added to Visual Studio 2010 to debug dumps of managed applications using CLR version 4, Visual Studio cannot debug dumps of managed applications running on versions of the CLR prior to v4
Q: Can Visual Studio debug dumps of 64bit processes?
A: Yes, Visual Studio can debug dumps of both 64 and 32 bit processes
Q: Do I have to debug a 64bit dump on a 64bit operating system?
A: Yes, you must be running on a 64bit operating system to debug a 64bit dump
Comments
Anonymous
October 13, 2010
OMG! This is so great, this tutorial should be advertise on Microsoft Connect.Anonymous
August 05, 2011
This is THE BEST tutorial that I have EVER seen on a Microsoft website. Very clearly written!Anonymous
December 20, 2011
I agree with these other two. This is a really well written article.Anonymous
February 07, 2012
I'm Still in Mess...ooh!Anonymous
April 26, 2012
I agree too ^_^ the best i ever seen in Microsoft helping articles . :-)Anonymous
September 17, 2012
That syntax is incorrect: C:>procdump –e –ma –x “C:My ApplicationsCrashingApp.exe” crash.dmp dmp must be typed before exe. Correct syntax: C:>procdump –e –ma –x crash.dmp “C:My ApplicationsCrashingApp.exe”Anonymous
June 01, 2013
@Foxtrott, thanks I have corrected the syntax in the postAnonymous
August 02, 2014
i can't get it to work on windows 8Anonymous
August 02, 2014
the command prompt say access is deniedAnonymous
October 27, 2014
Riley u must rus command prompt as administrator. click right mouse button and choose run as administrator.Anonymous
February 02, 2016
OK, so what do I DO with the dump file? I double-click it, it opens in Visual Studio, it tells me "Heap Information: Present", but I don't see any way to actually look at the heap information.

