Note
Access to this page requires authorization. You can try signing in or changing directories.
Access to this page requires authorization. You can try changing directories.
When doing live debugging you’ll use breakpoints at some point when tackling a problem.
A simple breakpoint is easy to use; however, when you are on the trenches you might need to use advanced breakpoints that save you a lot of manual work.
For instance, you may need to use a breakpoint that works only one time and changes the assembly code, changing the execution flow of your application. Or you may want to have a breakpoint that logs specific information to a file and then continues the execution.
You can even call a script from your breakpoint!
With breakpoints there’s no limit to creativity! J
First let’s start with Breakpoints 101.
Note: The Special Command section doesn’t cover all commands and variations. If you want to see all options, check the WinDbg documentation.
Options:
bp - Sets a new breakpoint at the address of the breakpoint location specified in the command. If the debugger cannot resolve the address expression of the breakpoint location when the breakpoint is set, the bp breakpoint is automatically converted to a bu breakpoint. Use a bp command to create a breakpoint that is no longer active if the module is unloaded.
bu - Sets a deferred or unresolved breakpoint. A bu breakpoint is set on a symbolic reference to the breakpoint location specified in the command (not in an address) and is activated whenever the module with the reference is resolved.
bm - Sets a new breakpoint on symbols that match a specified pattern. This command can create more than one breakpoint. By default, after the pattern is matched, bm breakpoints are the same as bu breakpoints. That is, bm breakpoints are deferred breakpoints that are set on a symbolic reference.
ba - This breakpoint is triggered when the specified memory is accessed.
Arguments for all of them:
<address/symbol> - Specifies the first byte of the instruction where the breakpoint is set. If you omit Address, the current instruction pointer is used.
[ /1] - Creates a "one-shot" breakpoint. After this breakpoint is triggered, it is deleted from the breakpoint list.
[ /c] - MaxCallStackDepth
Activates the breakpoint only when the call stack depth is less than MaxCallStackDepth. You cannot use this option together with /C.
[ “commands” ] - Specifies a list of commands executed every time the breakpoint is encountered the specified number of times. You must enclose the CommandString parameter in quotation marks. Use semicolons to separate multiple commands. Debugger commands in CommandString can include parameters. You can use standard C-control characters (such as \n and \" ). Semicolons that are contained in second-level quotation marks ( \" ) are interpreted as part of the embedded quoted string. The CommandString commands are executed only if the breakpoint is reached while the application is executing in response to a g (Go) command. The commands are not executed if you are stepping through the code or tracing past this point. Any command that resumes program execution after a breakpoint (such as g or t) ends the execution of the command list.
Arguments for ba only:
e (execute) |
Breaks into the debugger when the CPU retrieves an instruction from the specified address. |
r (read/write) |
Breaks into the debugger when the CPU reads or writes at the specified address. |
w (write) |
Breaks into the debugger when the CPU writes at the specified address. |
To see the breakpoints:
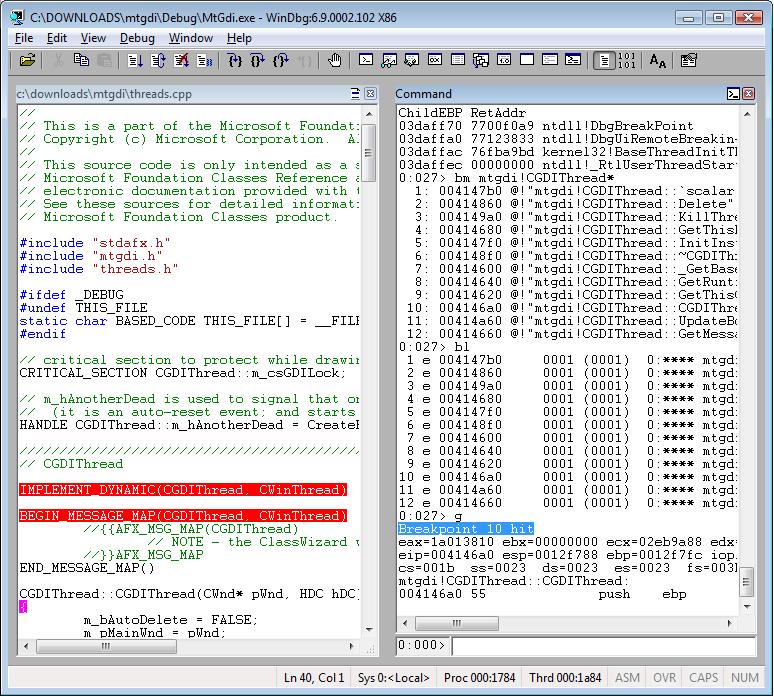
bl - Lists information about existing breakpoints.

Example of a basic breakpoint using symbol:
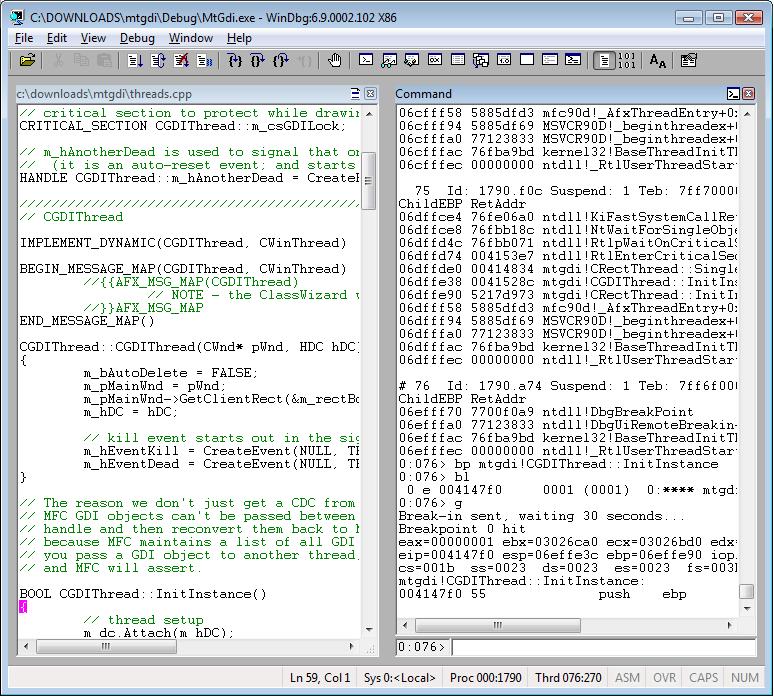
bp mtgdi!CGDIThread::InitInstance
Example of a basic breakpoint using address:
bp 00414d60


Example of setting a breakpoint based on a pattern:
bm mtgdi!CGDIThread*

Example of a one shot breakpoint. It’s deleted after the first hit; you can see it using bl:
bp /1 mtgdi!CRectThread::InitInstance


Example of a breakpoint using call stack limit:
bp /c 6 mtgdi!CBallThread::InitInstance

Example of a breakpoint using commands:
bp mtgdi!CBallThread::InitInstance ".echo CALL STACK; kpn 1000; .echo REGISTERS; r; .sleep 0n5000; gc"


Example of breaking on access:
ba w4 (0x02ed52b0 + 0x080)


Bonus example – count how many times a breakpoint was hit:
r @$t0 = 0 (press Enter)
bp < address/symbol > "r @$t0 = @$t0 + 1; .echo Number of times the breakpoint was hit; ? @$t0; gc" (press Enter)
g (press Enter)
Here you can see scripts that use breakpoints.
Comments
Anonymous
May 01, 2008
PingBack from http://www.basketballs-sports.info/basketball-chat/?p=1202Anonymous
May 02, 2008
Thanks for the bonus example, very cool.Anonymous
April 01, 2010
Hey there, Great blog you have here I am learning a lot from it. What I am wondering is the following. I did use some olly before and I am not fully understanding the use of Memory breakpoints and hardware breakpoints. In WinDBG a hardware breakpoint is called a processor breakpoint such breakpoint is the ba one. Does Windbg has a command to break on memory acces by using a software breakpoint?Anonymous
April 02, 2010
The comment has been removedAnonymous
April 02, 2010
Hey Roberto, Thanks for your quick reply. Well I am just playing around with some strings. I am trying to figure out where the string is being written or updated using software breakpoints. like for example the memory adress 402115 holds the ascii string test When pressing a hotkey it copies a new string into that. So I am kinda trying to see if there is a way to use a software breakpoint to catch the spot updating the string. I tried to use bp /a 402115 but when pressing the key nothing the debugger doesn't break. I guess I can only use a hardware breakpoint than? When using Olly Debugger I can set a memory breakpoint on acces (software breakpoint I assume) and the debugger catches it nicely. But I am not a big fan of Olly debugger so I was hoping WinDBG could do the same. thanks for the replies.Anonymous
April 03, 2010
The comment has been removed