Note
Access to this page requires authorization. You can try signing in or changing directories.
Access to this page requires authorization. You can try changing directories.
Have you ever had a situation where you find yourself debugging a dump from ASP.NET when suddenly you notice you forgot to get the Performance Monitor log?
If sometimes you face this situation, I have great news for you: this script shows you some of the main .NET Performance Monitor counters. It gets the information from the ASP.NET process or dump being debugged.
This is one of the coolest scripts I have!
Take a look at these screenshots:
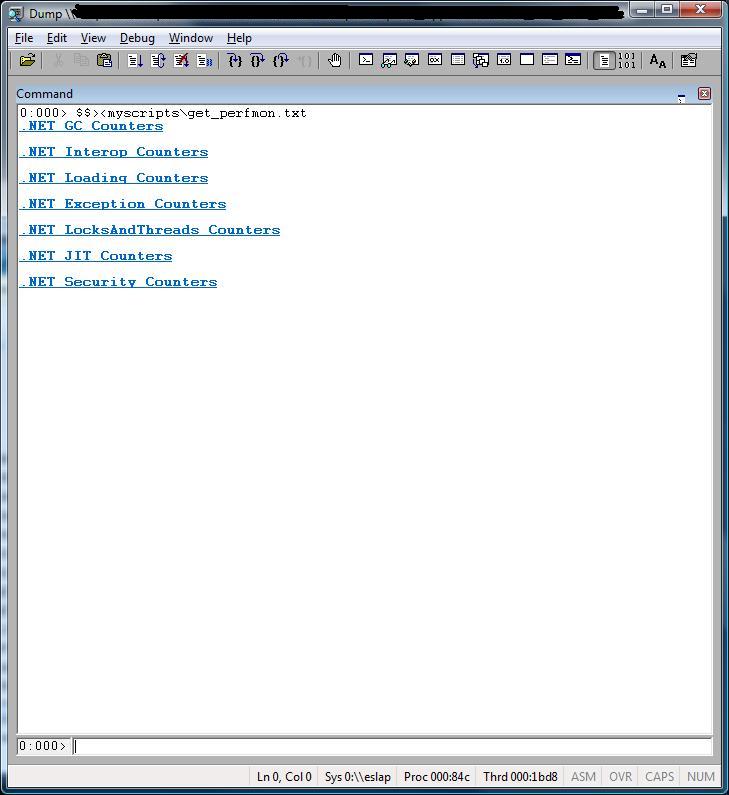
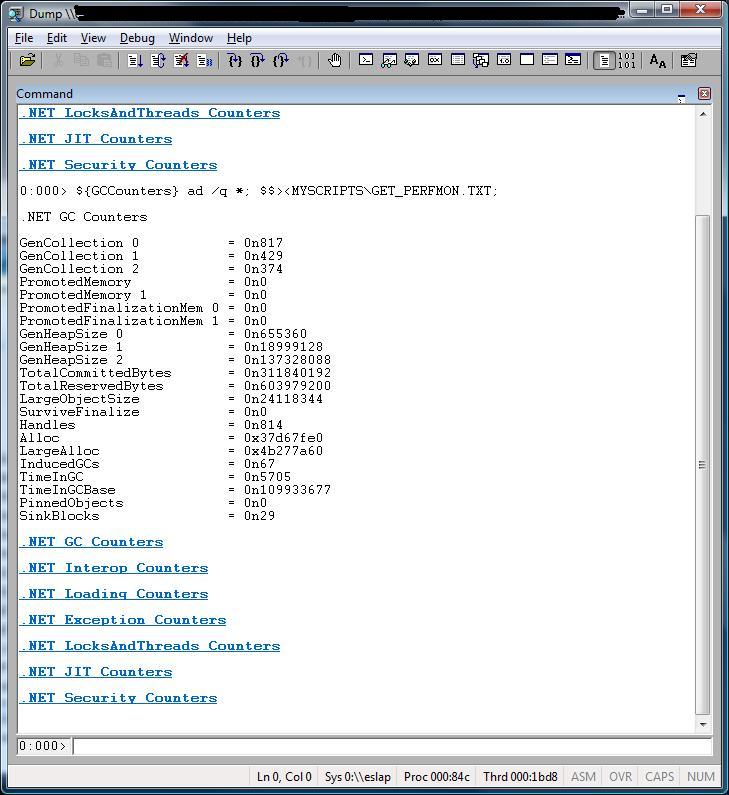
Source code for GET_PERFMON.TXT:
$$
$$ =============================================================================
$$ Get Performance Monitor counters from mscorsvr.dll or mscorwks.dll.
$$
$$ Compatibility: Win32/Win64 (This is a new version from 01/30/09)
$$
$$ Usage: $$>< to run the program.
$$
$$ Requirements: Public symbols.
$$
$$ If necessary change the filename below to include your path and filename.
$$ By default it uses the WinDbg path and the default file name is GET_PERFMON.TXT
$$
$$ Roberto Alexis Farah
$$ Blog: https://blogs.msdn.com/debuggingtoolbox/
$$
$$ All my scripts are provided "AS IS" with no warranties, and confer no rights.
$$ =============================================================================
$$
r @$t0 = 0;
r @$t1 = 0;
.block
{
as ${/v:ScriptName} MYSCRIPTS\\GET_PERFMON.TXT
}
.foreach(obj { lm1m })
{
.if((0 == $sicmp("${obj}", "mscorsvr")) | (0 == $sicmp("${obj}", "mscorwks")))
{
r @$t0 = ${obj}!PerfCounters::m_pPrivatePerf;
}
}
.if(0 == @$t0)
{
.printf /D "<b>\nThis is not a .NET application!\n</b>";
}
.else
{
.block
{
.block
{
as ${/v:GCCounters} .block
{
r @$t1 = poi(@$t0) + @$ptrsize;
.printf "\n.NET GC Counters\n\n";
.printf "GenCollection 0 = 0n%d\n", poi(@$t1);
.printf "GenCollection 1 = 0n%d\n", poi(@$t1+@$ptrsize);
.printf "GenCollection 2 = 0n%d\n", poi(@$t1+@$ptrsize*2);
.printf "PromotedMemory = 0n%d\n", poi(@$t1+@$ptrsize*3);
.printf "PromotedMemory 1 = 0n%d\n", poi(@$t1+@$ptrsize*4);
.printf "PromotedFinalizationMem 0 = 0n%d\n", poi(@$t1+@$ptrsize*5);
.printf "Process ID = 0n%d\n", poi(@$t1+@$ptrsize*6);
.printf "GenHeapSize 0 = 0n%d\n", poi(@$t1+@$ptrsize*7);
.printf "GenHeapSize 1 = 0n%d\n", poi(@$t1+@$ptrsize*8);
.printf "GenHeapSize 2 = 0n%d\n", poi(@$t1+@$ptrsize*9);
.printf "TotalCommittedBytes = 0n%d\n", poi(@$t1+@$ptrsize*0n10);
.printf "TotalReservedBytes = 0n%d\n", poi(@$t1+@$ptrsize*0n11);
.printf "LargeObjectSize = 0n%d\n", poi(@$t1+@$ptrsize*0n12);
.printf "SurviveFinalize = 0n%d\n", poi(@$t1+@$ptrsize*0n13);
.printf "Handles = 0n%d\n", poi(@$t1+@$ptrsize*0n14);
.printf "Alloc = 0x%x\n", poi(@$t1+@$ptrsize*0n15);
.printf "LargeAlloc = 0x%x\n", poi(@$t1+@$ptrsize*0n16);
.printf "InducedGCs = 0n%d\n", poi(@$t1+@$ptrsize*0n17);
.printf "TimeInGC = 0n%d\n", poi(@$t1+@$ptrsize*0n18);
.printf "TimeInGCBase = 0n%d\n", poi(@$t1+@$ptrsize*0n19);
.printf "PinnedObjects = 0n%d\n", poi(@$t1+@$ptrsize*0n20);
.printf "SinkBlocks = 0n%d\n\n", poi(@$t1+@$ptrsize*0n21);
}
}
.block
{
as ${/v:InteropCounters} .block
{
r @$t1 = poi(@$t0) + 0x74;
.printf "\n.NET Interop Counters\n\n";
.printf "CCW = 0n%d\n", poi(@$t1);
.printf "Stubs = 0n%d\n", poi(@$t1+0x4);
.printf "Marshalling = 0n%d\n", poi(@$t1+0x8);
.printf "TLBImports = 0n%d\n", poi(@$t1+0xc);
.printf "TLBExports = 0n%d\n\n", poi(@$t1+0x10);
}
}
.block
{
as ${/v:LoadingCounters} .block
{
r @$t1 = poi(@$t0) + 0x88;
.printf "\n.NET Loading Counters\n\n";
.printf "Current ClassesLoaded = 0n%d\n", poi(@$t1);
.printf "Total ClassesLoaded = 0n%d\n", poi(@$t1+0x4);
.printf "Current AppDomains = 0n%d\n", poi(@$t1+0x8);
.printf "Total AppDomains = 0n%d\n", poi(@$t1+0xc);
.printf "Current Assemblies = 0n%d\n", poi(@$t1+0x10);
.printf "Total Assemblies = 0n%d\n", poi(@$t1+0x14);
.printf "Time Loading = 0n%d\n", poi(@$t1+0x18);
.printf "AsmSearchLen = 0n%d\n", poi(@$t1+0x20);
.printf "Total LoadFailures = 0n%d\n", poi(@$t1+0x24);
.printf "LoaderHeapSize = 0n%d\n", poi(@$t1+0x28);
.printf "AppDomainsUnloaded = 0n%d\n\n", poi(@$t1+0x2c);
}
}
.block
{
as ${/v:ExceptionCounters} .block
{
r @$t1 = poi(@$t0) + 0xb8;
.printf "\n.NET Exception Counters\n\n";
.printf "Total Exceptions = 0n%d\n", poi(@$t1);
.printf "Filters Executed = 0n%d\n", poi(@$t1+0x4);
.printf "Finallys Executed = 0n%d\n", poi(@$t1+0x8);
.printf "ThrowToCatchStackDepth = 0n%d\n\n", poi(@$t1+0xc);
}
}
.block
{
as ${/v:LockAndThreadCounters} .block
{
r @$t1 = poi(@$t0) + 0xc8;
.printf "\n.NET Locks and Threads Counters\n\n";
.printf "Total Contention = 0n%d\n", poi(@$t1);
.printf "QueueLength Current = 0n%d\n", poi(@$t1+0x4);
.printf "QueueLength Total = 0n%d\n", poi(@$t1+0x8);
.printf "CurrentThreadsLogical = 0n%d\n", poi(@$t1+0xc);
.printf "CurrentThreadsPhysical = 0n%d\n", poi(@$t1+0x10);
.printf "RecognizedThreads Current = 0n%d\n", poi(@$t1+0x14);
.printf "RecognizedThreads Total = 0n%d\n\n", poi(@$t1+0x18);
}
}
.block
{
as ${/v:JITCounters} .block
{
r @$t1 = poi(@$t0) + 0xe4;
.printf "\n.NET JIT Counters\n\n";
.printf "Methods Jitted = 0n%d\n", poi(@$t1);
.printf "IL Jitted Current = 0n%d\n", poi(@$t1+0x4);
.printf "IL Jitted Total = 0n%d\n", poi(@$t1+0x8);
.printf "JIT Failures = 0n%d\n", poi(@$t1+0xc);
.printf "Time In JIT = 0n%d\n", poi(@$t1+0x10);
.printf "Time In JIT Base = 0n%d\n\n", poi(@$t1+0x14);
}
}
.block
{
as ${/v:SecurityCounters} .block
{
r @$t1 = poi(@$t0) + 0xfc;
.printf "\n.NET Security Counters\n\n";
.printf "Total RunTime Checks = 0n%d\n", poi(@$t1);
.printf "Time Authorize = 0n%d\n", poi(@$t1+0x4);
.printf "Link Checks = 0n%d\n", poi(@$t1+0xc);
.printf "Time RunTime Checks = 0n%d\n", poi(@$t1+0x10);
.printf "Time RunTime Checks Base = 0n%d\n", poi(@$t1+0x14);
.printf "Stack Walk Depth = 0n%d\n\n", poi(@$t1+0x18);
}
}
}
.printf /D "<link cmd=\"${GCCounters} ad ${/v:ScriptName};ad ${/v:GCCounters}; ad ${/v:InteropCounters};ad ${/v:LoadingCounters};ad ${/v:ExceptionCounters};ad ${/v:LockAndThreadCounters};ad ${/v:JITCounters};ad ${/v:SecurityCounters}; $$><${ScriptName}\"><b>.NET GC Counters</b></link>\n\n"
.printf /D "<link cmd=\"${InteropCounters} ad ${/v:ScriptName};ad ${/v:GCCounters}; ad ${/v:InteropCounters};ad ${/v:LoadingCounters};ad ${/v:ExceptionCounters};ad ${/v:LockAndThreadCounters};ad ${/v:JITCounters};ad ${/v:SecurityCounters}; $$><${ScriptName}\"><b>.NET Interop Counters</b></link>\n\n"
.printf /D "<link cmd=\"${LoadingCounters} ad ${/v:ScriptName}; ad ${/v:GCCounters}; ad ${/v:InteropCounters};ad ${/v:LoadingCounters};ad ${/v:ExceptionCounters};ad ${/v:LockAndThreadCounters};ad ${/v:JITCounters};ad ${/v:SecurityCounters}; $$><${ScriptName}\"><b>.NET Loading Counters</b></link>\n\n"
.printf /D "<link cmd=\"${ExceptionCounters} ad ${/v:ScriptName}; ad ${/v:GCCounters}; ad ${/v:InteropCounters};ad ${/v:LoadingCounters};ad ${/v:ExceptionCounters};ad ${/v:LockAndThreadCounters};ad ${/v:JITCounters};ad ${/v:SecurityCounters}; $$><${ScriptName}\"><b>.NET Exception Counters</b></link>\n\n"
.printf /D "<link cmd=\"${LockAndThreadCounters} ad ${/v:ScriptName}; ad ${/v:GCCounters}; ad ${/v:InteropCounters};ad ${/v:LoadingCounters};ad ${/v:ExceptionCounters};ad ${/v:LockAndThreadCounters};ad ${/v:JITCounters};ad ${/v:SecurityCounters}; $$><${ScriptName}\"><b>.NET LocksAndThreads Counters</b></link>\n\n"
.printf /D "<link cmd=\"${JITCounters} ad ${/v:ScriptName}; ad ${/v:GCCounters}; ad ${/v:InteropCounters};ad ${/v:LoadingCounters};ad ${/v:ExceptionCounters};ad ${/v:LockAndThreadCounters};ad ${/v:JITCounters};ad ${/v:SecurityCounters}; $$><${ScriptName}\"><b>.NET JIT Counters</b></link>\n\n"
.printf /D "<link cmd=\"${SecurityCounters} ad ${/v:ScriptName}; ad ${/v:GCCounters}; ad ${/v:InteropCounters};ad ${/v:LoadingCounters};ad ${/v:ExceptionCounters};ad ${/v:LockAndThreadCounters};ad ${/v:JITCounters};ad ${/v:SecurityCounters}; $$><${ScriptName}\"><b>.NET Security Counters</b></link>\n\n"
}
Comments
Anonymous
April 18, 2007
The comment has been removedAnonymous
April 19, 2007
Hi Tess! It's a honor for me to have your comments here! :) I'm fixing the script. Actually it was running fine on "some" .NET Framework 1.1 version and using m_pGlobalPerf , but as you mentioned, I use hardcoded offsets to avoid private symbols, so any change breaks functionality. I'm going to fix it right now! Thank you so much for finding these bugs!Anonymous
April 19, 2007
Now the script should work on .NET Framework 1.1 and .NET Framework 2.0 ThanksAnonymous
April 19, 2007
:) awesomeAnonymous
August 01, 2007
The comment has been removedAnonymous
August 01, 2007
Roberto, can you write something similar to extract the asp.net perf counters, like requests executing / queued / rps etc?Anonymous
August 01, 2007
Hi Satish, I think so. To do that I just need to know where the information is located (I'm not from ASP.NET team) and to have some free time to create it. :) Unfortunately I'm using my free time to work on a new tool (soon it will be posted), so I'll need to think about it later. Thanks for sharing this great idea and for reading my blog ;-)Anonymous
December 24, 2007
The comment has been removedAnonymous
May 01, 2008
With this blog post I try to explain how "magic" pointers and offsets work. I just copied the term "magic"Anonymous
May 30, 2008
Hello, Roberto It's very interesting script, however, compatibility problems still remain. All offsets in scripts depends on platform of target machine. As variant, may be try to use @$ptrsize: r @$t1 = poi(@$t0) + @$ptrsize; .printf "n.NET GC Countersnn"; .printf "GenCollection 0 = 0n%dn", poi(@$t1); .printf "GenCollection 1 = 0n%dn", poi(@$t1+@$ptrsize); .printf "GenCollection 2 = 0n%dn", poi(@$t1+@$ptrsize2); .printf "PromotedMemory = 0n%dn", poi(@$t1+@$ptrsize3); .printf "PromotedMemory 1 = 0n%dn", poi(@$t1+@$ptrsize4); .printf "PromotedFinalizationMem 0 = 0n%dn", poi(@$t1+@$ptrsize5); .printf "Process ID = 0n%dn", poi(@$t1+@$ptrsize6); .printf "GenHeapSize 0 = 0n%dn", poi(@$t1+@$ptrsize7); .printf "GenHeapSize 1 = 0n%dn", poi(@$t1+@$ptrsize8); .printf "GenHeapSize 2 = 0n%dn", poi(@$t1+@$ptrsize9); .printf "TotalCommittedBytes = 0n%dn", poi(@$t1+@$ptrsize0n10); .printf "TotalReservedBytes = 0n%dn", poi(@$t1+@$ptrsize0n11); .printf "LargeObjectSize = 0n%dn", poi(@$t1+@$ptrsize0n12); .printf "SurviveFinalize = 0n%dn", poi(@$t1+@$ptrsize0n13); .printf "Handles = 0n%dn", poi(@$t1+@$ptrsize0n14); .printf "Alloc = 0x%xn", poi(@$t1+@$ptrsize0n15); .printf "LargeAlloc = 0x%xn", poi(@$t1+@$ptrsize0n16); .printf "InducedGCs = 0n%dn", poi(@$t1+@$ptrsize0n17); .printf "TimeInGC = 0n%dn", poi(@$t1+@$ptrsize0n18); .printf "TimeInGCBase = 0n%dn", poi(@$t1+@$ptrsize0n19); .printf "PinnedObjects = 0n%dn", poi(@$t1+@$ptrsize0n20); .printf "SinkBlocks = 0n%dnn", poi(@$t1+@$ptrsize0n21); ThanksAnonymous
June 01, 2008
Hello, .rip Thanks for letting me know about this problem and thanks again for the proposed solution! Bright solution, since it's very simple! I like it! :) Have you tested it? If yes, let me know because I didn't have opportunity yet. RobertoAnonymous
June 02, 2008
Hello, Roberto Yes, I have tested ".NET GC Counters" succesfullyAnonymous
June 03, 2008
Done! The script was changed. Thanks for the contribution. ;-)Anonymous
June 11, 2008
Just can't stop wondering how awesome you and your work can be But a (dumb) question to you. how do you decipher from the dump the object layout of mscorwks!PerfCounters::m_pPrivatePerf. Many thanks for educating.Anonymous
June 11, 2008
Thanks for the kindly words! :) Your question is fair. Since I have access to the private symbols, I got the layout from the private symbols. Easy. ;)Anonymous
June 11, 2008
Thanks a lot for the response Just wanted to confirm that I would be resorting to dt mscorwks!Perfounters to decipher the layout. As you're Roberto (alpha geek) (and I'm sure you would be aware of hacking into the perf. counters content), would it be possible to dump the contents using dc command?????? Many thanks for educating me again!Anonymous
June 12, 2008
The comment has been removedAnonymous
June 16, 2008
Hello Roberto, Sounds something easy to do, I want to display a single character from a memory address. example: I have the string: 1002 a 1003 b 1004 c I do not have the n char at the end of this string. How can I display just the character 'a'? example: .printf (char)poi(1002) Something like that? There is any directive or command to display a range of characters using .printf? example: .printf "%ma",poi(1002) l 3 ?Anonymous
June 16, 2008
The comment has been removedAnonymous
September 03, 2008
http://blogs.msdn.com/debuggingtoolbox/archive/2007/04/19/windbg-script-extracting-performance-monitor-counters-from-net-application.aspxAnonymous
January 30, 2009
It has been a long time since my last post, but I’m back on the blog. The article for today is aboutAnonymous
July 16, 2010
A novice question: Is this method/script only valid for ASP.NET? Or can it be used towards any .NET application (like a GUI app, console app, Windows service, or web service)?Anonymous
July 21, 2010
David, you can run this script with any .NET application. It shouldn't break the script. Any problems let me know :) Thanks, RobertoAnonymous
November 10, 2010
Hi Roberto, I'd like to be able to extract many more of the Performance counters - both from some of the .NET Perf Counters as well as the "Process" counter. Any assistance you can provide in helping me is greatly appreaciated. Thank you for your time and this awesome script!Anonymous
November 12, 2010
Hi Dave, The Process counter and others are not there, at least for CLR before version 4.0, and the only reason I could create this script is because I replaced what would be calls to methods visible with private symbols for the proper offsets.Anonymous
November 12, 2010
hi Roberto, Thanks for the reply! Could you please provide the offsets so that I can add those counters to my copy of your script?Anonymous
November 12, 2010
hi Roberto, Thanks for the reply! Could you please provide the offsets so that I can add those counters to my copy of your script?Anonymous
November 14, 2010
The offsets are in the source code. For example: printf "PromotedMemory 1 = 0n%dn", poi(@$t1+@$ptrsize*4); @$ptrsize is the number of bytes a pointer has based on the architecture (32 or 64 bits) You can track @$t1 to get the base address. ;-)Anonymous
November 17, 2010
I'm not quite sure what "source code" you're referring to.
- Where would the source code/offsets be for the Windows and .NET Performance Counters?
- I thought you were only able to get the offsets for the counters you originally implemented because you have access to the private symbols which I obviously do not. You lost me here....
Anonymous
November 17, 2010
Hi Dave, Ok, I guess now I understand your question. :) You're right, you'd need access to private symbols. Because I have I got the offsets so I could create a script that works with public symbols. In other words, offsets won't be helpful to you. BTW, offsets instead of names are a good approach if you intend to create an script for your application and you want to be able to use Public Symbols or just hide private information from people that have access to your script. Thanks, RobertoAnonymous
November 17, 2010
Is it possible for you to provide the offsets for the other .NET Performance Counters as well as the "Process" performance counter?Anonymous
November 17, 2010
Unfortunately I cannot do that. :( Sorry.Anonymous
November 18, 2010
Hi Roberto, Thanks for being patient with my questions. I just really want to expand the counters & info that this awesome script provides. Is there any way that I could add these? SSCLI? some other way? Thank you for your time : )Anonymous
January 07, 2011
Hi Dave, Sorry for my delay to answer. I don't know of other methods and I've never used SSCLI before. You may want to ask other bloggers. ThanksAnonymous
February 25, 2014
Hi Roberto, I'm running your GetPerfMon counter script and I'm getting back some odd values. I'm wondering if the offsets are still valid for .NET 4.5 (x64) which is what my app is using. Thank you for your time! daveAnonymous
February 25, 2014
Hi Dave, You are correct. I haven't had time to update my debuggers scripts yet. Sorry about that. RobertoAnonymous
May 20, 2014
Hi Roberto, Is there anything I can do to help update the debugger scripts for .NET 4.5? I desperately need them for some memory dumps I've been working on. Thank you for your consideration :)Anonymous
May 20, 2014
Hi Dave, It's my plan to update this script and the dig_stack.txt (which needs to work for 64bits ASAP). However, since I'm not using the debugger for a while during my work it'll be hard to find time. :-S On the other hand, not sure if you are familiar with the PerfView tool - blogs.msdn.com/.../tools-for-your-debugging-toolbox.aspx but this is a tool that can save your day if you need to analyze .NET memory/performance related issues. This tool came after this script was created otherwise I don't think I'd have created the script. (ok, maybe for fun :-)) So take a look and let me know if it does what you need. ThanksAnonymous
August 17, 2014
Hi Roberto, I did take a look at PerfView and unfortunately doesn't quite fit my needs unfortunately. It helps but doesn't tell me anything I can't already get from WinDbg.