Azure Operational Insights Search How To: Part VI – Measure Avg(), and an exploration of Type=PerfHourly
This is the sixth installment of a Series that walks thru the concepts of Microsoft Azure Operational Insights Search Syntax – while the full documentation and syntax reference is here, these posts are meant to guide your first steps with practical examples. I’ll start very simple, and build upon each example, so you can get an understanding of practical use cases for how to use the syntax to extract the insights you need from the data.
In my first post I introduced filtering, querying by keyword or by a field’s exact value match, and some Boolean operators.
In the second post I built upon the concepts of the first one, and introduced some more complex flavors of filters that are possible. Now you should know all you need to extract the data set you need.
In the third post I introduced the use of the pipeline symbol “|” and how to shape your results with search commands.
In the fourth post I introduced our most powerful command – measure – and used it with just the simplest of the statistical functions: count() .
In the fifth post I expanded on the measure command and showed the Max() statistical function. And gave ‘homework’ to try Min() on your own ![]()
This time, I will show you one other favorite of mine to be used with measure, the Avg() statistical function. As you can imagine, this allows you to calculate the average value for some field, and group results (as usual with Measure – we discussed this in the 4th post) by some (other or same) field.
This is useful in a variety of cases, my favorite one being Performance data, but there are other interesting use cases.
Let’s start with Performance data, anyhow, as it probably is the easiest to understand.
Before I do that, let me remind you that – at the time of this writing – we only collect specific fabric-related performance counters for VMM and HyperV hosts as part of the ‘Capacity’ Intelligence Pack.
We are anyhow tracking ideas to collect Custom-defined Performance Counters on our feedback forum – go ahead and vote on them if you would like us to enable that functionality!
- Collect Custom Performance Counters from Windows Agents https://feedback.azure.com/forums/267889-azure-operational-insights/suggestions/6519061-collect-custom-windows-performance-counters
- Collect Custom Performance Metrics from Unix/Linux Agents https://feedback.azure.com/forums/267889-azure-operational-insights/suggestions/6519187-collect-performance-metrics-for-unix-and-linux-ser
- Collect Custom Performance Counters for Azure PaaS Cloud Services from Windows Azure Diagnostics Storage https://feedback.azure.com/forums/267889-azure-operational-insights/suggestions/6519356-collect-custom-performance-counters-from-windows-a
For these ideas, we would also like to understand the granularity of collection you expect to see – the current performance data collected by Capacity Intelligence Pack is only indexed in pre-computed hourly aggregations. What does this mean? It means that for each Computer\Performance Object\Performance Counter Name\Instance Name (as in perfmon) we currently index ONE RECORD in search for each hourly interval (24/day).
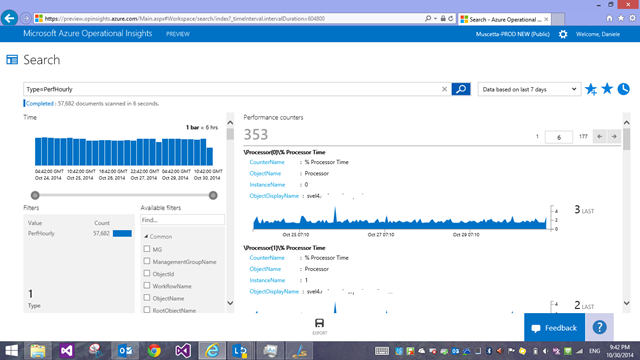
Let’s see what this means. If I search for ALL performance data, the most basic query would be
Type=PerfHourly
the first thing you notice is that OpInsights shows you also charts of those performance counters
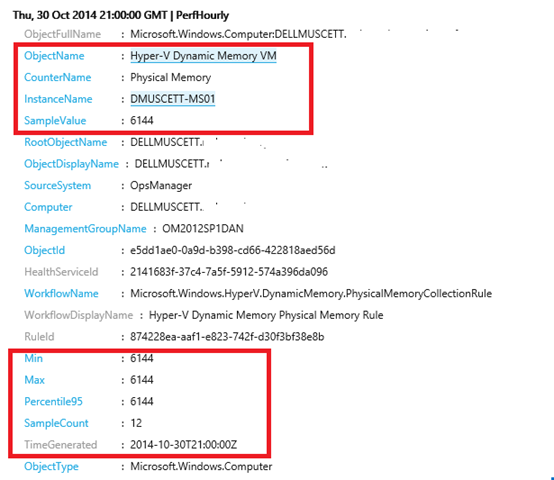
this is convenient, of course, but let’s scroll to the bottom and look at the actual records that are behind those charts, and how do they look like
Look at the screenshot above and the two sets of fields I circled in red and notice a few things:
- the first set lets you identify the Windows Performance Counter Name, Object Name and Instance Name in your query filter. These are the fields you probably will most commonly use as facets/filters.
- ‘SampleValue’ is the actual value of the counter (more in a second on this…)
- Type=PerfHourly = this is an hourly aggregate
- TimeGenerated: it is at 21 o’clock. It is the aggregation for that hourly bucket from 20:00 to 21:00
- SampleCount - the aggregation was computed using 12 samples (one every 5 minutes)
- the minimum, maximum and 95th percentile for the hourly bucket was – in this case for memory for one of my VM’s – always 6144 (megabytes)
- ‘SampleValue’ – back to it - since this record is a hourly aggregate, ‘SampleValue’ is populated with the AVERAGE for the hourly bucket.
- this field is what is used to plot the performance charts
- we left this name (rather than a more explicit Avg) because this way we can later introduce ‘raw’ (non pre-aggregated) performance data (where ‘SampleValue’ will be the actual value picked from perfmon at a specific time, unprocessed) and by keeping this field name the same, both the per chart as well as the most common queries you’d write will continue to work, unchanged, across ‘raw’ or ‘aggregated’ data.
So after all this explaining of the PerfHourly record ‘shape’, and having read the previous blog posts, you can now understand how to use measure Avg() to aggregate this type of very ‘numerical’ data.
Simple example:
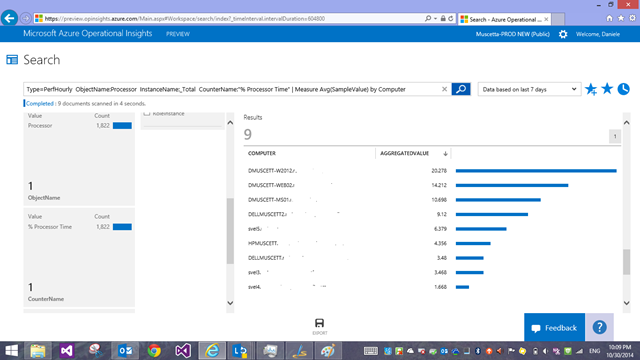
Type=PerfHourly ObjectName:Processor InstanceName:_Total CounterName:"% Processor Time" | Measure Avg(SampleValue) by Computer
By now, with all the previous blog posts and examples and filtering and using measure with other functions, this should be clear – we select the CPU Total Time performance counter and we ask an Average by Computer. Easy.
You might notice that, since ‘SampleValue’ is already an average, you are really asking an average of an average. That’s correct with Type=PerfHourly at the moment, but you see where this will be more precise and useful when we’ll have a raw Type=Perf, or similar, not pre-aggregated. For the time being, we suggest always throwing a filter on TimeGenerated (see 2nd post where we talked about time filters) to restrict the operation to a small/recent dataset – i.e. the last 4 hours, not 7 days!
So our query above becomes
Type=PerfHourly ObjectName:Processor InstanceName:_Total CounterName:"% Processor Time" TimeGenerated>NOW-4HOURS | Measure Avg(SampleValue) by Computer
Try it now. You will see this recent average will generally be higher.
Or with a twist, you could calculate the average of the Maximum hourly values, i.e.
Type=PerfHourly ObjectName:Processor InstanceName:_Total CounterName:"% Processor Time" TimeGenerated>NOW-4HOURS | Measure Avg(Max) by Computer
Even more interesting – one of my absolute favorite scenarios – is aggregating/correlating data ACROSS machines, something that was VERY HARD to do with System Center Operations Manager and something I really wanted to simplify.
Let’s imagine we have a set of hosts in some sort of farm where each node is equal to any other one and they just do all the same type of work and load should be roughly balanced… I could get their counters all in one go with the following query and get averages for the entire farm! Let’s start with choosing the computers
Type=PerfHourly AND (Computer=”SERVER1.contoso.com” OR Computer=”SERVER2.contoso.com” OR Computer=”SERVER3.contoso.com”)
(note that today you have to do an OR – but this could become a subsearch in the future, that could be used to express a ‘dynamic group’ – check out and vote this idea on our feedback forum in this regard https://feedback.azure.com/forums/267889-azure-operational-insights/suggestions/6519209-allow-subqueries-in-the-search-language-in-not
In any case, now that we have the computers, we also only want to select two KPI – % CPU Usage and % Free Disk Space. This part of the query becomes:
Type=PerfHourly InstanceName:_Total ((ObjectName:Processor AND CounterName:"% Processor Time") OR (ObjectName="LogicalDisk" AND CounterName="% Free Space")) AND TimeGenerated>NOW-4HOURS
If we now put all together – machines and counters:
Type=PerfHourly InstanceName:_Total ((ObjectName:Processor AND CounterName:"% Processor Time") OR (ObjectName="LogicalDisk" AND CounterName="% Free Space")) AND TimeGenerated>NOW-4HOURS AND (Computer=”SERVER1.contoso.com” OR Computer=”SERVER2.contoso.com” OR Computer=”SERVER3.contoso.com”)
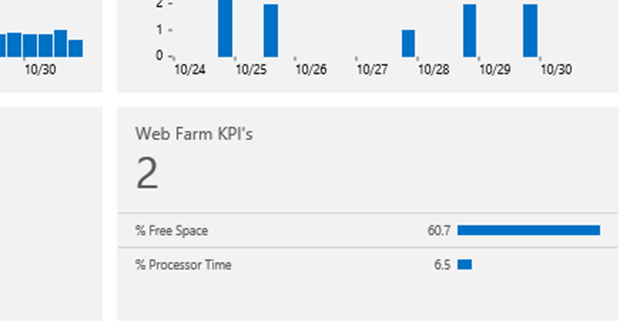
and now that we have this very specific selection, the measure Avg() command can tell us the average not by computer, by across the farm, simply by grouping by CounterName:
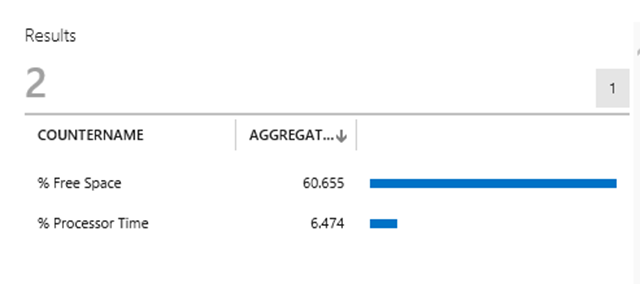
Type=PerfHourly InstanceName:_Total ((ObjectName:Processor AND CounterName:"% Processor Time") OR (ObjectName="LogicalDisk" AND CounterName="% Free Space")) AND TimeGenerated>NOW-4HOURS AND (Computer=”SERVER1.contoso.com” OR Computer=”SERVER2.contoso.com” OR Computer=”SERVER3.contoso.com”) | Measure Avg(SampleValue) by CounterName
which gives me this beautiful compact view over a couple of my farm’s KPI’s – at a glance I know:
and this, btw, looks great in a dashboard:
I am hoping with these examples you are starting to see how easy it is to quickly look at your environment’s data with the use of the search filters and commands.
Till next time, happy searching!
Comments
Anonymous
May 30, 2015
The comment has been removedAnonymous
August 04, 2015
Is there any ways we I can usage of Data per Computer wise in GB format which is being uploaded in OMS.Anonymous
August 04, 2015
@Jason - no, search doesn't know how many bytes those records were on the wire, when received - which is when we measure them. In fact, if you send MORE data, you will achieve some bandwidth savings since things are batched together pretty efficiently... There is work going on in the 'Usage' page to make it more informative and allow slicing and dicing by some other dimension - track the idea on the feedback forum here feedback.azure.com/.../6714359-add-a-cost-calculator-or-explain-usage-stats-easie
