Troubleshooting exceptions in a Windows Phone app
You know the situation – you develop and debug your app, all works well and you deploy it onto the phones of a few testers or friends. Then, you get reports of the app just disappearing. An app crashing on a phone typically just looks like the app just disappearing and the tiled start screen showing up again.
If you are troubleshooting as a developer and you have the phone in front of you, connected to your PC, this is no problem. You can debug the app interactively from Visual Studio (and if you are debugging interactively you can even remotely capture a dump file and pull it back over the wire for later analysis at your leisure.
But what if you cannot get direct access to the phone all the time or debug interactively from Visual Studio?
Well, one option is to use the awesome utility Field Medic which you can install on the phone and use to collect diagnostic traces and information.
It has many uses but one thing it can do is capture crash dumps of crashing apps and also ETW traces originating from .NET/CLR telling you details of the crash.
Assuming you have a way to reproduce the app crashing on your phone, here is how to figure out why it is happening.
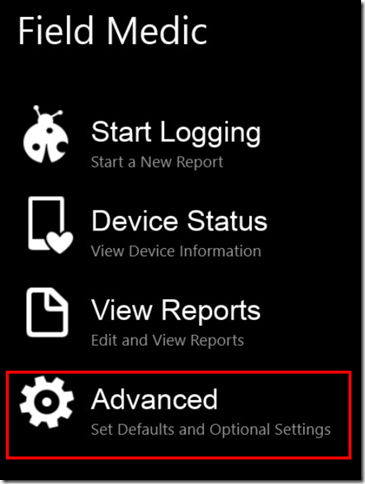
Launch Field Medic and select Advanced:
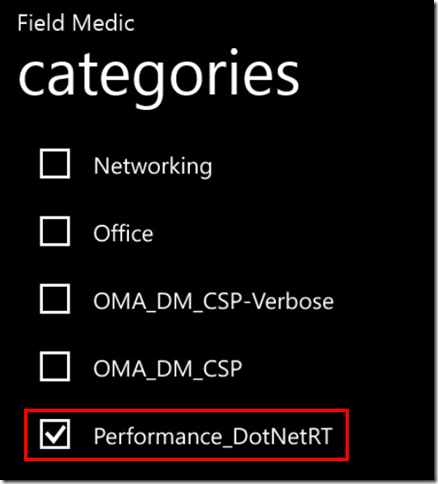
Tap on ‘Categories’ and deselect them all but select the ‘Performance_DotNetRT’ one:
This will capture Event Tracing for Windows (ETW) logs relevant to .NET/CLR.
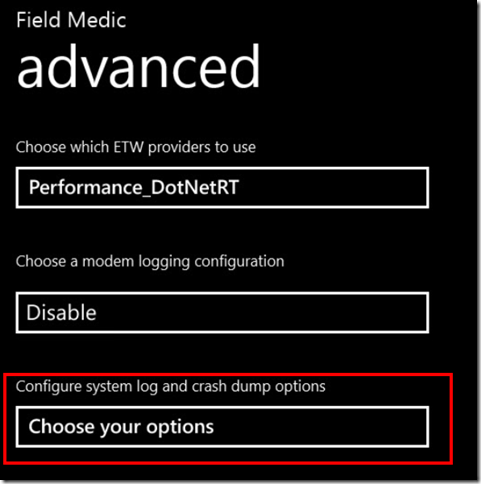
Now if you also want to generate crash dumps for the issue (if you like delving into WinDBG) tap on ‘Choose your options’ under “Configure system log and crash dump options’:
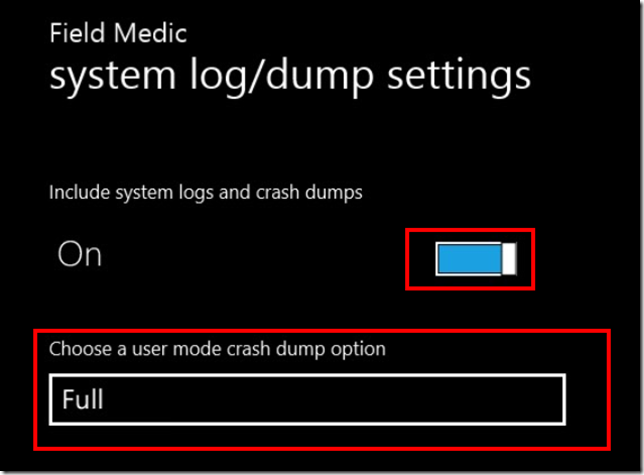
Turn that on and select ‘Full’:
I won’t be going into the specifics of looking at the crash dumps in this blog post.
It is a good idea to minimise the number of apps running – just try to keep it to the app you are investigating. Traces are for the whole phone, not just your app.
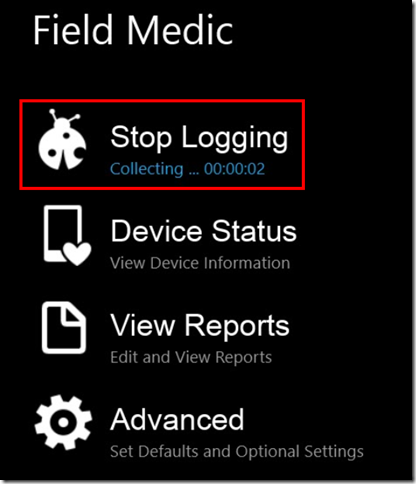
Now back on the home page of Field Medic, tap on ‘Start Logging’ and you should see this after a moment or two:
Now reproduce the crash in your app, switch back to Field Medic (or re-launch it if it is no longer running) and select ‘Stop Logging’:
The ’Stop Logging’ phase may take a few extra seconds (sometimes quite a few!) if you have selected the Full Dump option.
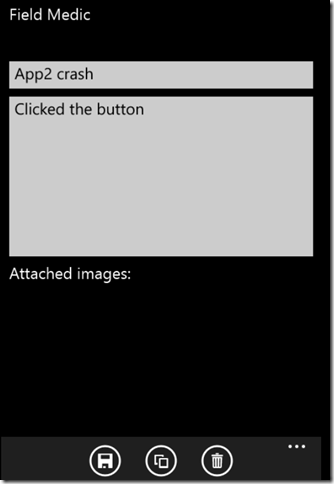
You will be prompted to give your report a name and some contextual information:
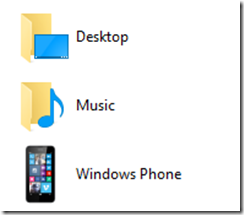
Now connect your phone to your PC with and navigate to it in Windows Explorer:
If your phone was already connected to your PC, you may need to disconnect it and reconnect it before you see the new content on the phone file system. It seems to be a limitation of the USB based transport used to connect PC and phone that it does not auto-refresh. This was at least the case with Windows Phone 8.1 though it seems to be fixed in latest Windows 10 Mobile builds from what I can tell.
Navigate into the “This PC\Windows Phone\Phone\Documents\FieldMedic\reports” folder and copy the entire report folder off the phone. The report folders have names like this:
WPB_000_20160420_120713
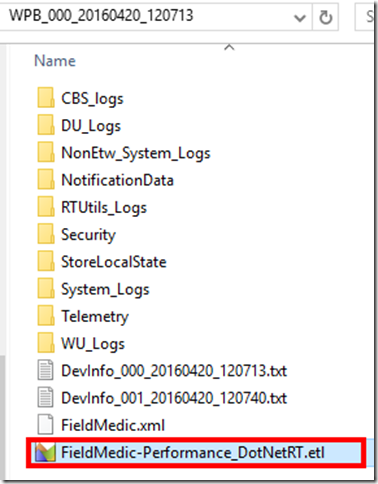
Field Medic traces, among other things, captures Event Trace Log (ETL) files. There are various ways to read these specially formatted files but one of the most fast and convenient I find is the multi-talented PerfView.
Navigate into the report folder to locate the single ETL we collected:
and open it with PerfView.
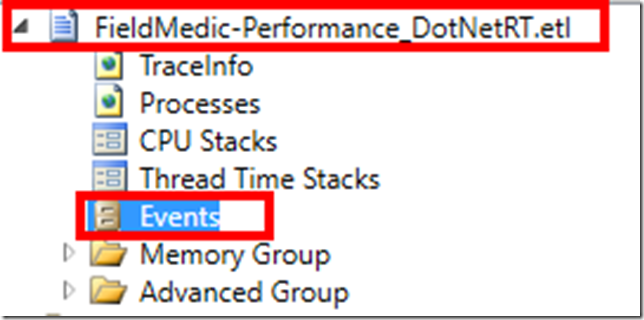
Once in there, in the PerfView UI navigate to the ‘Events’ node under the node for the ETL:
This will open a new window for exploring the ETL contents
Now type ‘exception’ into the event types filter box and click update:
Hopefully you will now see a filtered list of events on the right. Note there may be some innocuous exception events going on from other apps that are not relevant.
In this example however we can see an entry from my app, which is called App2 (ok, so perhaps I am not cut out for marketing!)
If I click on that event and Ctrl+C here is what I get:
“HasStack="True" ThreadID="704" ExceptionType="System.NullReferenceException" ExceptionMessage="Object reference not set to an instance of an object." ExceptionEIP="0x35f1d36" ExceptionHRESULT="-2,147,467,261" ExceptionFlags="CLSCompliant" ClrInstanceID="10" ”
If it is a complex app with other non-crashing exceptions going on you might need to look at whether that was the last event logged by that instance of App2 to know whether it was the exception that brought the process down or not.
In this case, we now know that at System.NullReferenceException killed the process at instruction pointer address 0x35f1d36. Hmm, interesting but maybe not useful, yet.
Note, however, the HasStack=”True” in the above. Sounds useful, right?
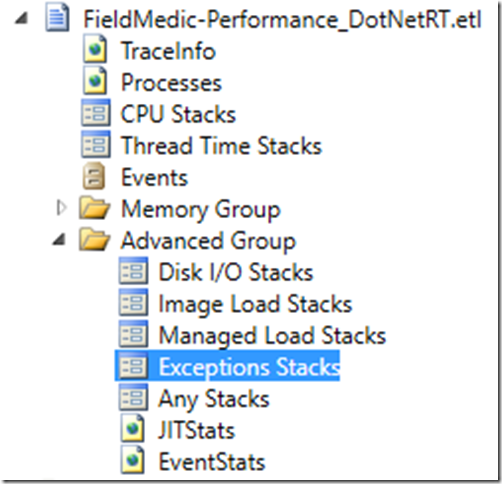
Close that PerfView window you’ve been working in and go back to the primary window. Navigate into the “Advanced Group” and double-click on ‘Exception Stacks’:
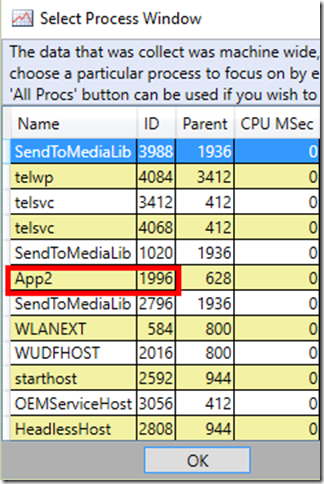
You’ll get a process selection window open – now double click on the entry for your app:
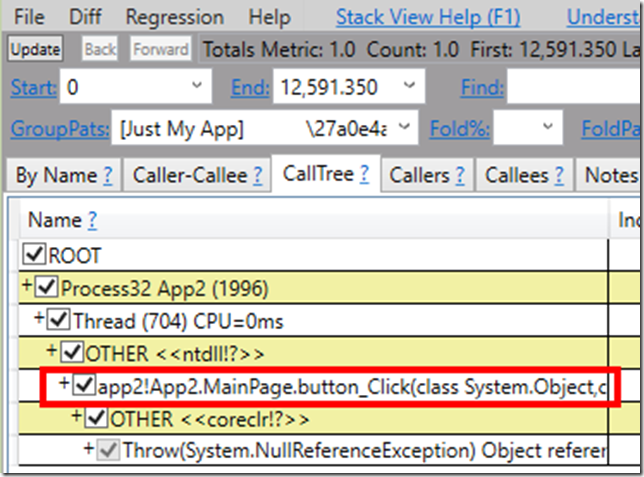
A new window will appear showing stacks for exceptions that happened within the App2 process during the trace. In this case there is only one and it is the exception we are interested in:
Thankfully, this time, it tells me the function in my app where the exception was thrown. That is enough of a clue to get me on the right track and figure out what went wrong.
If you need to go deeper and you selected the Full Dump option earlier, you will find the full memory dump in the Documents\Debug folder (on Windows Phone 8.1):
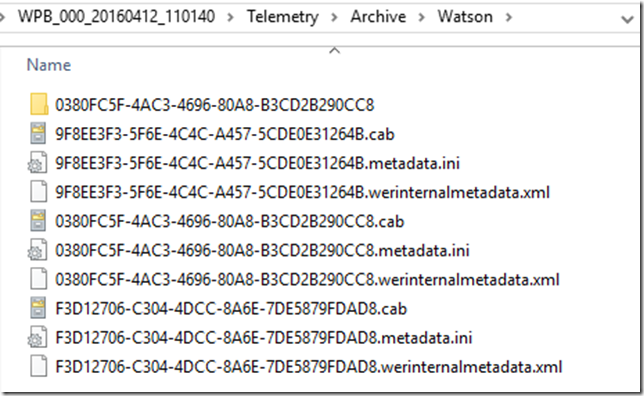
If you are looking for the dump file on Windows 10 Mobile, it seems things have changed slightly and Field Medic pulls the dump file out of the Documents\Debug folder and CABs it up with Watson telemetry data within the Field Medic report:
Of course, I could have instrumented my app with HockeyApp and got crash reports that way ![]() .
.
Here are some additional references:
Use Field Medic to generate a report
Windows/Phone 8.1 Debugging: Getting a Crash Dump File From a Device
HTH
/D
