Missing Data in Operation Manager 2012 Dashboard’s Performance Widget
One of my favorite new features in SCOM 2012 is the Dashboard. It’s a perfect way to surface SCOM data easily to a wide spectrum of people.
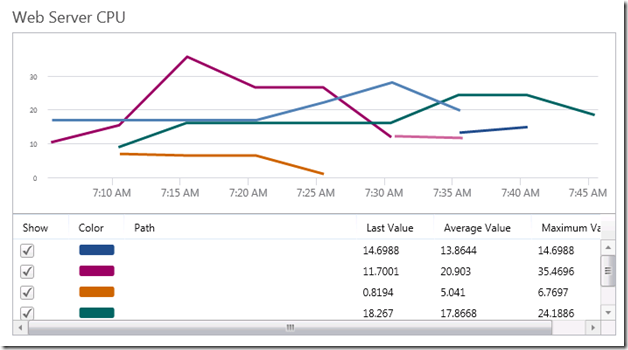
One of the first dashboards we created included a performance widget however we did not get the graph that we expected:
Why are the lines all funny looking?
To understand the problem better you have to first understand how the performance widget works. If you look at the image, I set my timeline to only the last one hour. Based on the introduction article - https://blogs.technet.com/b/momteam/archive/2011/10/04/widgets-performance-widget.aspx, this means that the data is being pulled from the raw tables in the Data Warehouse. The following chart helps to visualize this:
| Time Range Selected | Source of Data |
| < 100 Hours | Raw Data |
| 100 Days > < 100 Hour | Hourly Aggregate |
| > 100 Days | Daily Aggregate |
So this means we were missing some of the raw data necessary to graph the line. Since I was not getting any alerts around failing to store data in the Data Warehouse I went to investigate the performance collection rule in the Management Pack. It was here I found that this specific rule was using the Optimized Data Provider and this was very likely the root cause. To provide some background, a performance collection rule (which is how performance data gets into SCOM) can use one of many data provider modules. These modules are in charge of reading and outputting System.Performance.Data data at a timed interval which will then get sent to the configured data sources (typically the OperationsManager and OperationsManagerDW databases).
The Optimized Data Provider is special in that it will only send data if the value delta has changed by a specified tolerance amount. An example of this is that if the % Processor Time\_Total counter stays at 5%, only the first instance will be sent and a configured number of instances will then be “skipped”. (I am putting this in extremely basic terms and glossing over some details, to learn more about this module check out - https://msdn.microsoft.com/en-us/library/ee809318.aspx)
If you clicked through to the module description you noticed that there is a way to turn “convert” the data collection back to unoptimized:
The System.Performance.OptimizedDataProvider module type can output both optimized and unoptimized data. Unoptimized data results in a performance data item being returned once every specified polling interval. Use this when you want to collect every performance data value, regardless of whether the value has changed since the last polling interval.
To specify unoptimized collection, set the Tolerance parameter to 0 and set the MaximumSampleSeparation to 1.
Now that we knew we can “fix” this with an override, we had to figure out what rule the override will apply to. The easiest way to find the rule in the SCOM console is to open up a performance view of a server, right-clicking on the counter in the list on the bottom and selecting “Show or edit rule properties”
One thing to remember before making this change, this data provider is used on purpose as it helps to reduce the network traffic from the agent and the load on the SCOM databases. I would recommend not performing this override on all performance collections but only to a select few.
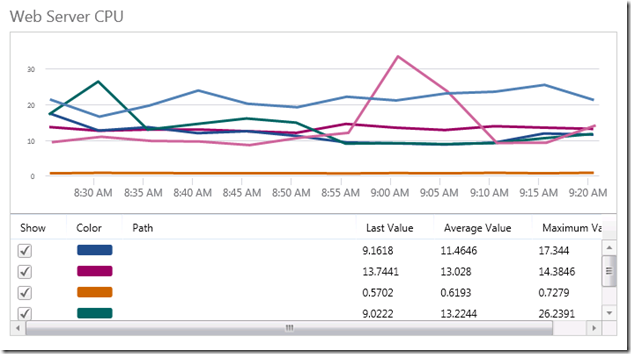
After the overrides were processed by the server agents, all performance data was being sent to the Management Server and both the OperationsManager and OperationsManagerDW databases.
Checking out our dashboard, we saw nice solid lines and no confusion for viewers!
Happy Monitoring!

