Tracing Client-side
When you connect IAG for the first time a “client” (in fact a bunch of sub components) are installed on the machine (there are other ways to install the client than online install). Later they will be loaded when needed when you connect IAG, or load application that are tagged as “high secure”.
For example one of these sub components (ActiveX or Java) will analyze the workstation, another one will clean out the cache even if the machine crashes… etc.
But why tracing the client-side?
Here is a good from the field example: I had several times feedback from customers or partners that it is very slow to see the IAG login page. It is the case when IAG is used as a mobility gateway, but it is even more frequent when using IAG internally, as a “portal/SSO” system.
Tracing Browser HTTP traffic will not help since IAG client is not going though the browser to connect IAG server, so you are just blind if you use this method.
Activating “client-side” tracing helps to understand what IAG client-side components are doing, and of course understand why it is slow. Most of the case, problems are due to the infrastructure itself.. and most of the time, it is due to DNS slow response time, or Certificate CRL problems. Once you know what the problem is, you just have to fix it and it works just great.
Here is the procedure to activate the tracing on the IAG client-side (tracing pure “browser” HTTP traffic is done using tools such as HTTP watch or fiddler).
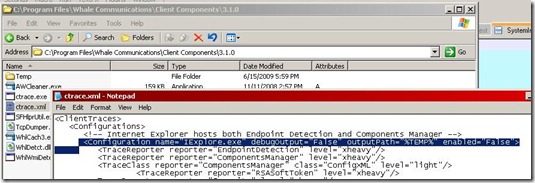
On the workstation itself (not the server, since we trace the client-side), go in : C:\Program Files\Whale Communications\Client Components\3.1.0
Edit the file called Ctrace.XML.
Below you can see an extract of this file, and look at the line which contains “Iexplore.exe”.
Change the values in yellow below. Here you activate the trace, and also specify the location of the log files.
<ClientTraces> <Configurations> <!-- Internet Explorer hosts both Endpoint Detection and Components Manager --> <Configuration name="IExplore.exe" debugOutput="true" outputPath="C:\temp\Ctrace" enabled="true"> <TraceReporter reporter="EndpointDetection" level="xheavy"/> <TraceReporter reporter="ComponentsManager" level="xheavy"/> |
Of course in this example, you need to create this “c:\temp\ctrace directory”, where the log will be generated.
Once finished, save the file and execute CTRACE.EXE located in the same directory. This “execute” will in fact activate the trace.
Configuration is finished. Next time you run your browser and connect Iag, the “client-side” of IAG will create a log and dump a lot of things.
What is in this log ?
There are in fact a lot of stuff in this file, all the things that the developers wanted to trace.
The method I usually use is to look at the fist column (it is a ; delimited file). This column is the date/time, so I usually look at the time, PAGE DOWN X times until I see a significant time different (half a second or more). Then I look at the lines causing this “slow” response time.
Good tracing !
