System Center 2012 R2 Configuration Manager - Software Update Compliance Dashboard
Software Update Compliance Dashboard – Part 1
I created this blog due to the responses I’ve received from my previous blog (https://blogs.technet.com/b/gary_simmons_mcs/archive/2013/12/09/creating-a-custom-report-for-system-center-2012-r2-configuration-manager-part-1.aspx) on creating custom SSRS dashboard for Configuration Manager. I used a Software Update dashboard just as an example but it seems there is a lot of interest in Software Update dashboards.
Reporting on Software Updates can be tricky because depending on the organization different people or groups may want to see numbers in different ways. Executives or Senior Management may just want to know if they are “good” and look at percentages while mid-level management may want to know what part of their enterprise is good. Security groups tend to want to know what updates are missing while looking at trending data, System Administrators want to know what systems are missing updates and CM Administrator’s what to know how the updates are being managed.
The default Software Update reports are based off of Software Update Groups (SUG) and collections that need to be managed. It’s good for the System\CM Administrators but usually requires someone creating custom charts either in Excel or PowerPoint to brief on the Software Update posture to security or management. Additionally, they don’t give a quick timeline view on when updates were released or allow for trend analysis.
This blog describes a Software Update Compliance dashboard with Security in mind. It is formatted in a way that should appease management while giving detailed information to administrators managing the systems or deployments. It doesn’t rely on SUG’s, collections, or unmanaged systems and allows CM Administrators to deploy updates however they choose.
Software Update Compliance Dashboard – Part 2
The Software Update Compliance dashboard is broken into three main sections; Assets, Software Update Information, and Compliance separated between servers and workstations.
By default, the dashboard displays information for each operating system within a 12 month period starting from the month the report was run on. You can change the default behavior by modifying the @StartDate or just change the Start Date after the report has run.
Each report allows the type (Category) of update to be filtered on. By default, each report has Security Updates defined. You can change the default behavior by modifying the @Category parameter.
The software update information is gathered from each managed system. A managed system is defined as a non-obsolete client that has performed its software update scan within the last 14 days. The number of days is defined with the @DaysScanned parameter.
A couple things to note are the exclusions of Windows XP, Vista, and Windows 8. The results seen in this dashboard include all applicable updates for the devices. There isn't a method to include or exclude specific updates to the report.
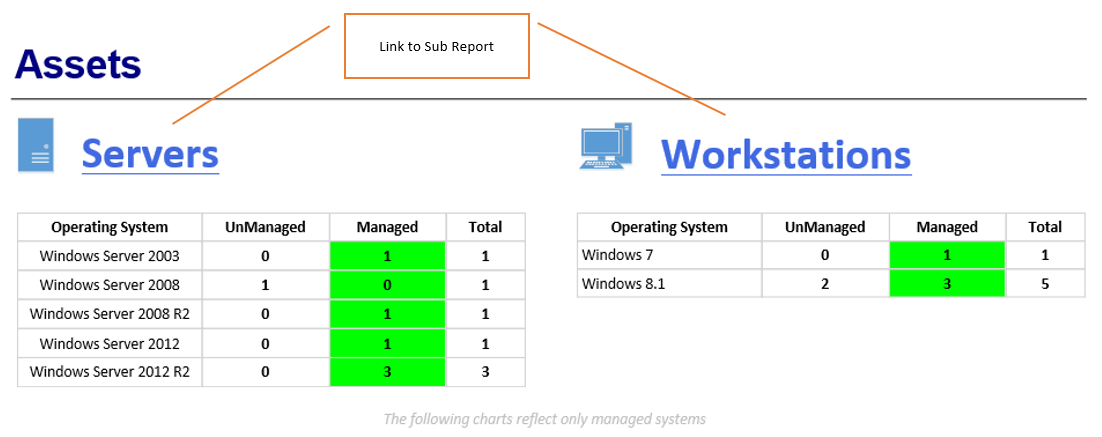
Section 1 – Assets
The top of the dashboard sets the stage for each chart as it displays the number of systems that are being reported on for each operating system.
It is very important to understand that unmanaged systems will not be reflected in the dashboard. All compliance and applicable data seen in the dashboard is derived from the v_Update_ComplianceStatus view from systems that have performed a successful scan within the defined parameter.
This means that all the system objects that can be seen in the Configuration Manager console aren’t being reported on since it is very common to have outdated information in the CM Database.
The Operating System value is pulled from Operating_System_Name_and0 column in the v_r_system view. This information is populated from AD discovery so the dashboard isn’t dependent on hardware inventory to complete. The issue with the Operating_System_Name_and0 view is that it isn’t a friendly name for non-technical people so it is translated in each SQL query. This means that “Microsoft Windows NT Workstation 6.3 (Tablet Edition)” and “Microsoft Windows NT Workstation 6.3” are converted to “Windows 8.1”. Also “Microsoft Windows NT Server 6.3” and “Microsoft Windows NT Advanced Server 6.3” are converted to “Windows Server 2012 R2” since the applicable patches are the same and it just makes it easier to understand.
In the Assets section it is possible to click Servers or Workstations to drill down into the systems that make up the numbers.
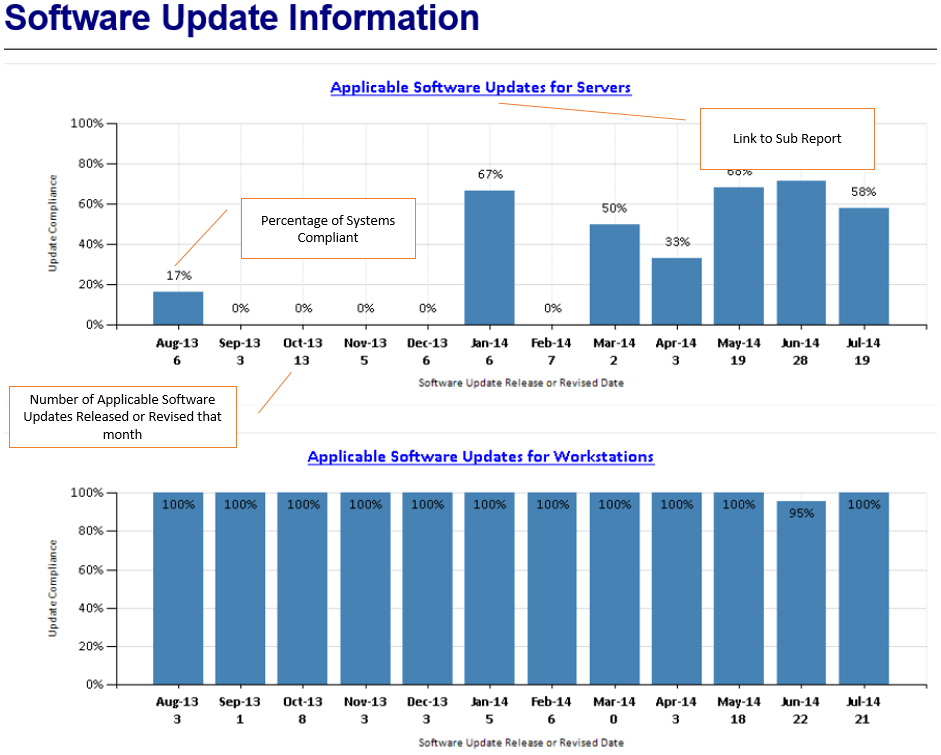
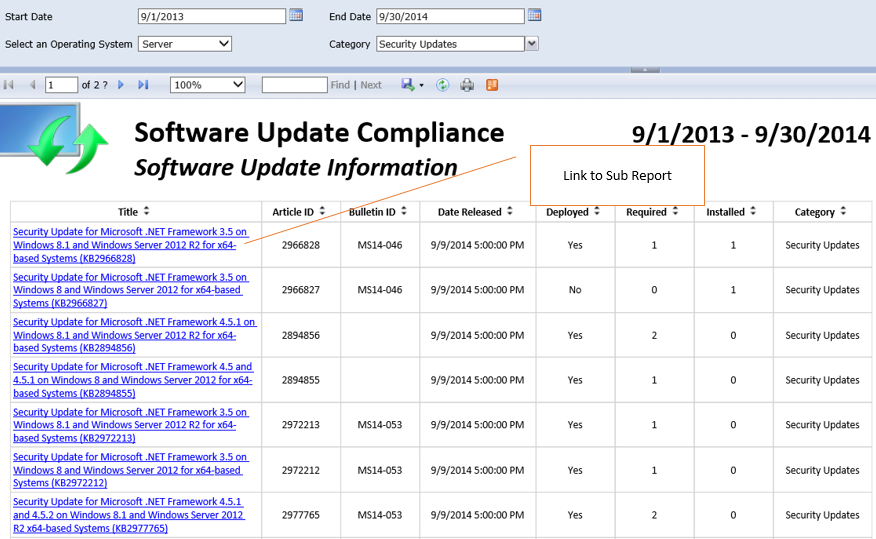
Section 2 – Software Update Information
The Software Update Information section shows the number of applicable software updates that were released or revised during the 12 month reporting period. It also shows the compliance for updates released that month.
Each chart has a link to a sub report that will display more detailed software update information.
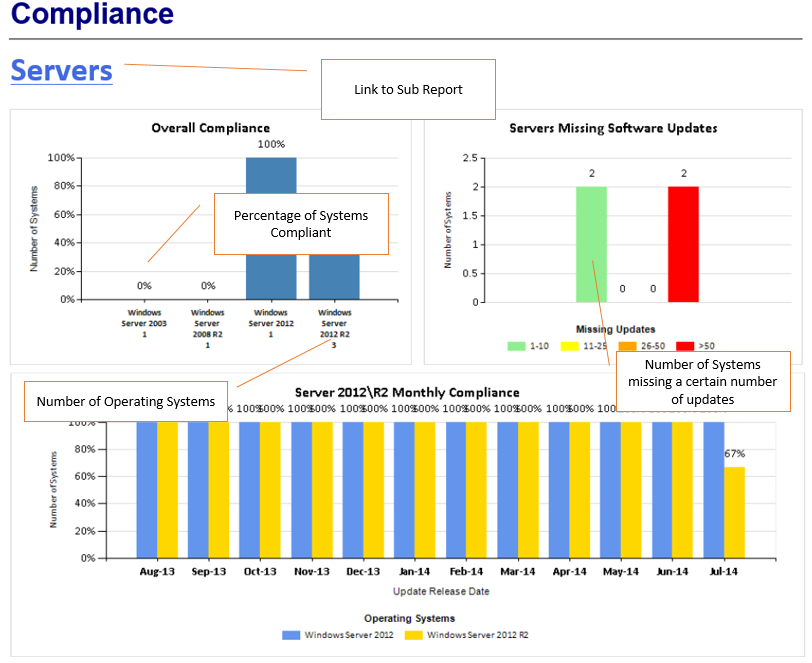
Section 3 – Compliance
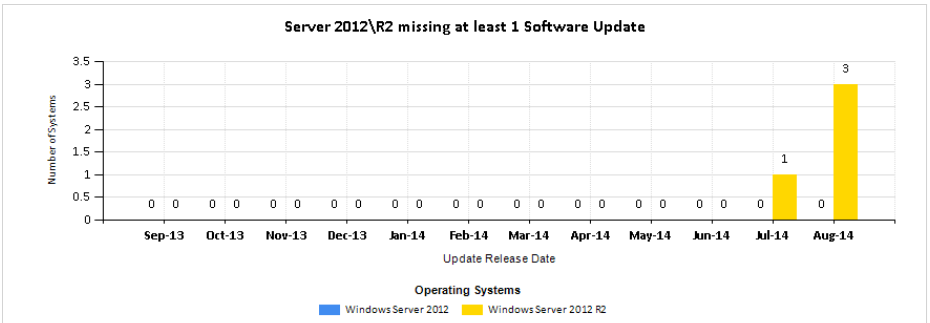
This section is separated between Servers and Workstations with four different charts; Overall Compliance, Systems missing a certain amount of updates, Operating System Compliance, and Operating Systems missing at least 1 update.
The Servers link will run a sub report showing more detailed information regarding server operating systems.
Sub Reports - Part 3
The Software Update Compliance dashboard contains links to sub reports that allow you to drill down into specific information.
The orange arrows indicate the path in which the sub reports are linked.
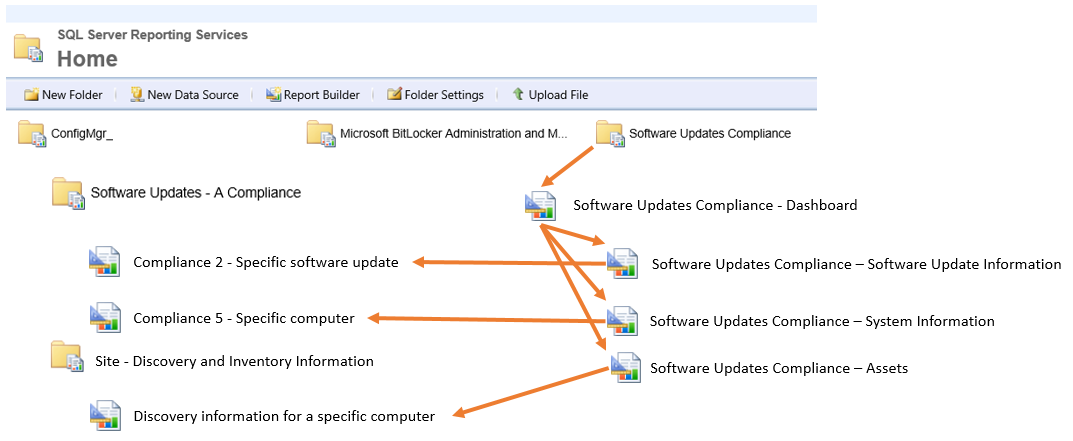
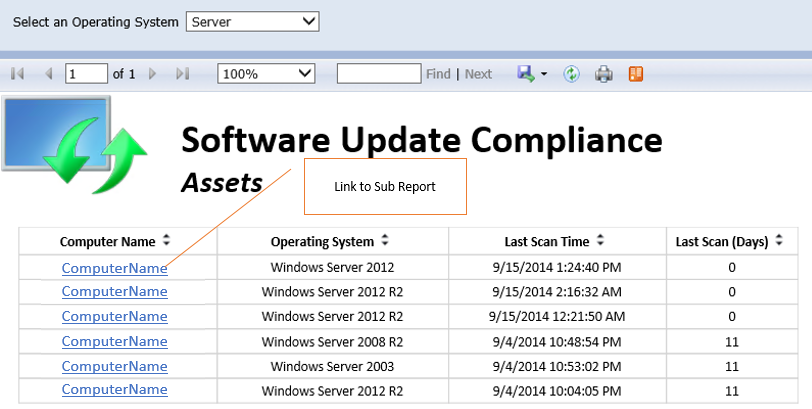
Assets
The Software Update Compliance – Assets sub report displays the systems where the Last Software Update scan falls within the managed parameter @DaysScanned.
Software Update Information
The Software Update Compliance – Software Update Information sub report shows information pertaining to software updates that are applicable to managed systems within a period of time, operating system, and type of Software Update.
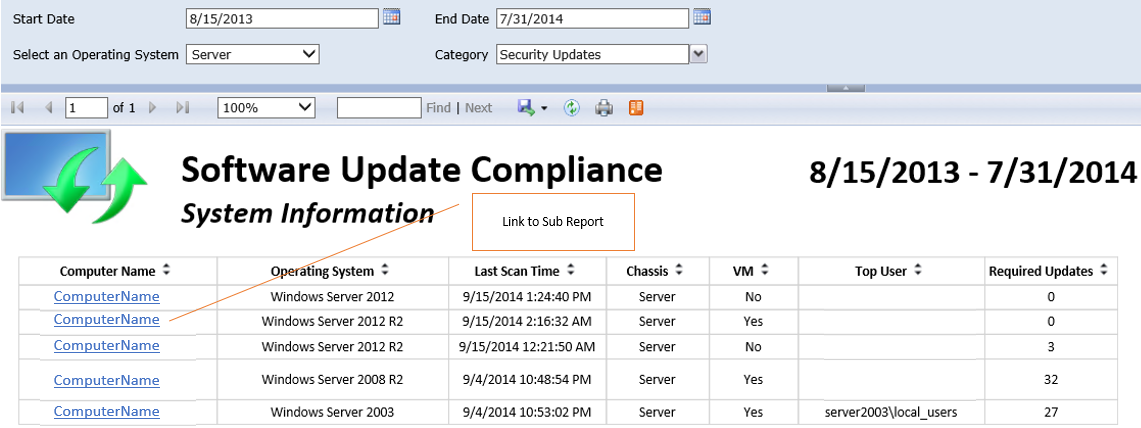
System Information
The Software Update Compliance – System Information sub report shows information on each managed system. The report can be filtered within a period of time, by operating system, and by the type of software update.
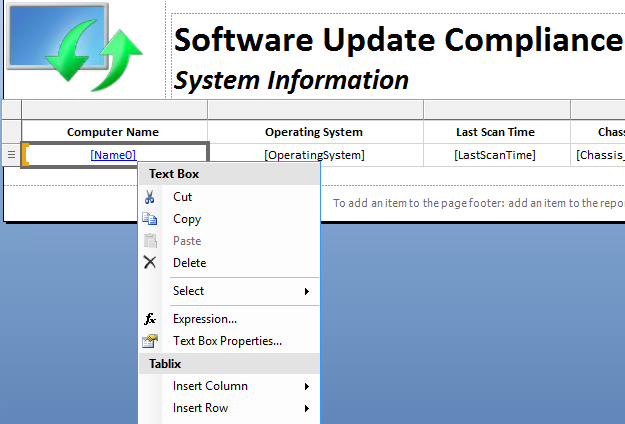
I've attached a zip file containing 4 .rdl files to this blog. To install the dashboard create a folder in the SSRS home page called Software Updates Compliance and place each .rdl file in it. Modify each report with your data source. For each sub report right click the text box with the hyperlink then select Text Box Properties.
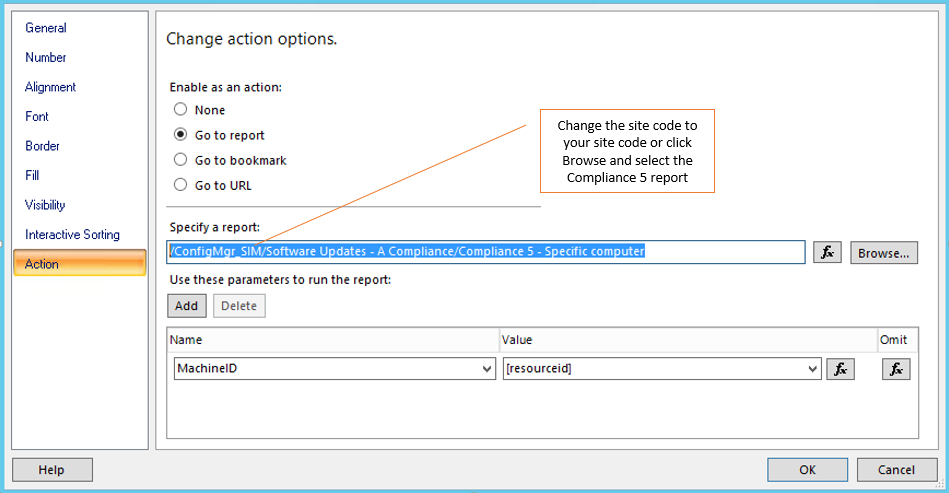
Click Action then change the link to the report to have your site code in it. for example, Change /ConfigMgr_SIM/Software Updates - A Compliance/Compliance 5 - Specific computer to /ConfigMgr_SI1/Software Updates - A Compliance/Compliance 5 - Specific computer
If you place the .rdl files anywhere else you'll need to change the link locations for the sub reports.
This dashboard is still being developed so if you plan on using it make sure to validate the accuracy of it in your environment. I have not tested updates imported with System Center Updates Publisher however, it should work with those updates.
When time permits, I plan on updating the dashboard to allow each bar in the charts clickable to a sub report. I also plan on capturing the data to a separate database to allow for trend analysis or comparisons between different time periods.
Updates
28 Jan 2015 - v1.1
Updates to the Dashboard
- Most Column charts are clickable and link to a sub report
System Information
Added parameter for the group of missing updates
Added a Filter to limit the results based on a computer name
Modified the dataset to display systems that didn’t have a top user
Modified the Chassis column to display the chassis number
Changed Chassis type 3 from Server to Desktop
Modified the dataset to correctly display if a system is a VM
Assets
- Added a Filter to limit the results based on a computer name
5 Aug 2015 - v1.2
- Added support for Windows 10
- Removed support for Server 2003
- Included Version number in footer
Software Updates Compliance v1.2.zip
Comments
- Anonymous
January 01, 2003
great post, thanks for sharing. - Anonymous
January 01, 2003
The comment has been removed - Anonymous
January 01, 2003
Excellent. thanks for the nice reports .it will help others for sure to start customize these reports that suit the organisation. - Anonymous
January 01, 2003
Nice Reports!
I managed get everything working, but when I select "Servers" on Software Updates Compliance - Dashboard page I get error: The item '/Software Updates Compliance/Software Updates Compliance - Assets' cannot be found. (rsItemNotFound)
But if I select Assets page on Software Updates Compliance folder the page works fine.
Any ideas why it does not work? - Anonymous
January 01, 2003
Never mind the earlier comment. Just had to add the /ConfigMgr_XXX there. - Anonymous
January 01, 2003
Dan,
Thanks for pointing that out. I forgot to mention that you'll need to modify the sub reports link to point to your CM site.
In this case change the Site Code to your 3 letter site code in the link. As and example, change '/ConfigMgr_SIM/Software Updates - A Compliance/Compliance 2 - Specific software update' to '/ConfigMgr_DAN/Software Updates - A Compliance/Compliance 2 - Specific software update'. You could also click the browse button and select the Software Updates - A Compliance/Compliance 2 - Specific software update report and it'll update the link for you.
I'll update the blog to have these steps included. - Anonymous
January 01, 2003
Very good arcitecture. Thank you. - Anonymous
January 01, 2003
Randall,
You'll need to modify each workstation dataset to either include Windows XP (Workstation 5.2) or not to exclude it. You may have to teach the charts a little too.
For instance, the Workstation_Compliance_Month dataset has this in the query:
(Select count(rs.ResourceID) from v_r_system rs JOIN v_UpdateScanStatus uss on uss.ResourceID = rs.ResourceID where rs.Operating_System_Name_and0 like '%Workstation 6.3%' And DATEDIFF("d",uss.LastScanTime,getdate()) <= @DaysScanned AND rs.Obsolete0 = 0) [Windows 8.1 Total]
You'll need to copypaste it and change '%Workstation 6.3%' to '%Workstation 5.2%'
Other datasets may have something along this:
where (rs.Operating_System_Name_and0 like '%Workstation 6.1%' OR rs.Operating_System_Name_and0 like '%Workstation 6.3%')
Just add in another OR rs.Operating_System_Name_and0 like '%Workstation 5.2%' - Anonymous
January 01, 2003
The comment has been removed - Anonymous
January 01, 2003
sandip,
To describe the query in detail would be a very lengthy post but to quickly describe it, the query collects the rownumber (up to 12) on v_UpdateInfo since there should be more than 12 entries. Each rownumber corresponds to a month (eg. 1 =January, 2 = February, etc). Then while iterating through the months the installation count is pulled. The key to doing this is using the WITH Common Table Expression (https://technet.microsoft.com/en-us/library/ms190766(v=sql.105).aspx).
You could take the dataset query then put it into SQL Server Management Studio. Depending on your TSQL abilities you should be able to see how the data is being calculated by month.
The series data in the charts performs the calculation to get the percentage. It should be something similar to this: (Total_Updates - Total_Required) / Total_Updates. The charts does the actual formatting of the percentage too.
Hope that helps. - Anonymous
January 01, 2003
Chris T and Thomas,
When I get a moment I'll look at it but my lab is very small at this time.
Could you check my comment to Nico and see if what you're experiencing is due to the parameters in the sub report? - Anonymous
January 01, 2003
I'm currently in the process to making the dashboard a little more user friendly such as having the column charts clickable and additional filters on the sub reports.
When Windows 10 is supported I plan on including it into the dashboard.
If there is anything someone would like to see feel free to let me know. - Anonymous
January 01, 2003
Mark,
Near the bottom of the post I have instructions to change the links for the sub reports.
Click Action then change the link to the report to have your site code in it. For example, Change /ConfigMgr_SIM/Software Updates - A Compliance/Compliance 5 - Specific computer to /ConfigMgr_SI1/Software Updates - A Compliance/Compliance 5 - Specific computer - Anonymous
January 01, 2003
The comment has been removed - Anonymous
January 01, 2003
Ren,
Update the Required_Updates dataset in the System Information sub report query to look for the model. What is in there now is something I was working on to give more details about the VM but didn't take it out when I published the file.
Change this part:
WHEN gscs.Model0 in ('Virtual Machine', 'VRTUAL - 1000831', 'VRTUAL - 5000805', 'BIOS Date: 05/05/08 20:35:56 Ver: 08.00.02', 'A M I - 2000622', 'A M I - 9000520', 'A M I - 9000816', 'A M I - 6000901', 'A M I - 8000314') Then 'Yes'
To this:
WHEN gscs.Model0 in ('Virtual Machine', 'VMware Virtual Platform', 'Xen', 'VirtualBox') Then 'Yes'
That should cover most VM scenarios. If it still shows up as not a VM can you please tell me what the system is showing for it's model? You can do this several ways but running msinfo32.exe is probably the easiest. - Anonymous
January 01, 2003
Judical,
This dashboard shows information on "all" applicable updates for Operating Systems and not limited to Software Update Groups (SUG) or collections.
You'd have to modify the dataset to use a specific collection and SUG to get the information you're looking for. Other than being presented in charts, this is similar to the default reports. To make this dashboard work similar to the default reports will require a good amount of modifications to the queries and modifying each report to use collectionsSUGs as parameters.
I do plan on making one more dashboard (a true single page dashboard) similar to this one that can be limited by collections and SUG's. Until then, feel free to use this dashboard as an example on creating your own. - Anonymous
January 01, 2003
Thomas,
I believe I understand your issue now. In the Software Update Information charts you'll see the number of application updates for that month under the month name. That number is not a number for unique updates (although this could be changed in the properties) and is the total amount of applicable (either required or installed) updates.
When you click the bar it will link to the sub report. The sub report shows the unique update with a column for required and installed. If you added up both columns it should equal the total applicable number of updates. - Anonymous
January 01, 2003
Mark,
If you are able to provide which sub report, chart, and link you are clicking I could check on it. The issue in your first response is trying to go to a path that you most likely don't have unless your site code happens to be SI0. If you change the site code to your site code it should work. - Anonymous
January 01, 2003
Jason,
The queries in this dashboard doesn't gather compliance like the built-in reports do. It'll be a lengthy reply to explain it in detail but the main query can be found in Part 5 of my previous blog post (link is at the top) and a visual mapping on the SQL tables in this one: http://blogs.technet.com/b/gary_simmons_mcs/archive/2015/02/17/system-center-2012-r2-configuration-manager-software-update-compliance-compare-compliance-dashboard.aspx
Keep in mind that this dashboard has additional parameters such as the category, "managed" systems, and dates that need to be taken into account. Other that what is determined "Managed" you can change the parameters at the top of each report.
Depending on what built-in report you are running, what you may be seeing is the difference between compliance of "Managed" vs "UnManaged" systems. - Anonymous
September 16, 2014
Great Reports!
But you have to create a folder "Software Updates Compliance" (Not Software Update Compliance) otherwise the subreports won't work. - Anonymous
September 18, 2014
Hi,
first of all: AWESOME post and great job. This is exactly what I've been looking for, much cred to you, sir!
Now my question: I've created and named the report folder correctly (Software Updates Compliance) but the drill down reports aren't working. It tries to connect to your database :)
'/ConfigMgr_SIM/Software Updates - A Compliance/Compliance 2 - Specific software update' cannot be found. (rsItemNotFound)
I tried changing the action on the hyperlink in SQL RB to go to the correct report in my database, but I still get the same error. What to do? - Anonymous
September 18, 2014
Hi Gary Simmons, excellent job! I changed the reports links and it's work fine!
Excellent! - Anonymous
September 18, 2014
Amazing
many thanks - Anonymous
September 18, 2014
Excellent, Excellent, Excellent!! - Anonymous
September 22, 2014
sorry but can someone help i have been trting to get this to work and i am not sure i have copied the datasource from another report and i can not get it to work, please can you assist? - Anonymous
September 23, 2014
I really appreciate your diving deeper into SU like this. I'm personally working on a report that shows some of this info but is more geared toward a pre/post update window report. Some of the elements will surely come in handy FOR SURE. - Anonymous
September 23, 2014
Gary, If I run the report "Software Updates Compliance - System Information" directly I get results. If I select one of the devices (servers) I get an error: "An attempt was made to set a report parameter 'MachineID' that is not defined in this report. (rsUnknownReportParameter)"
Not sure how to fix this one. Everything else seems to be in order (after updating the datasource and links in each report as noted) - Anonymous
September 23, 2014
Thanks for updating the post. Got it all working now. Once again, many thanks for a great job! Will use this daily. SQL reporting is very interesting and I will try to learn much more about it. - Anonymous
September 24, 2014
Awesome work. Didn't take long to setup, following your steps. I'm going to show this to our management and see what they think. How difficult would it be to add RBAC to the reports? - Anonymous
October 16, 2014
Great article. I've got the Reports up and running. COuld you possibly show how to remove the exclusions of XP and Vista? - Anonymous
November 18, 2014
Great Reports!!
I unable to link (sub report) to Software updates compliance -Assets, because Site-Discovery and inventory Information not listing in our SCCM 2012 R2 SSRS. Please advise.. - Anonymous
December 18, 2014
This is awesome! Really great way of showing compliance for software updates. Thank you, and let us know when you have any updates to share. - Anonymous
January 13, 2015
These are excellent reports! Thank you! I am puzzled why I'm not seeing any of the Compliance info on the main Dashboard. I see the Assets section and the Security Update Information. All my links work but I'm not seeing any of the OS-specific graphs like Servers Missing Specific Updates. - Anonymous
January 13, 2015
Oops. Just found that the Dashboard has 2 pages! All the extra stuff is there! - Anonymous
January 21, 2015
Another great dashboard. Always love not having to re-invent the wheel. :) - Anonymous
January 23, 2015
Hi Gary,
Thanks for these amazing reports.
I have one question - when I run these reports especially, system information (which populates the physical/VM, it is not providing the information as "VM" for VM servers.
Can you please extend your help? - Anonymous
January 28, 2015
Wow, thanks Gary. You've made my day! :-D
If I can give 1 comment: on compliance charts you always put 'Number of Systems' on the vertical axis, while some tables show a percentage and not a number. - Anonymous
February 04, 2015
These are the best reports I've seen thus far, thanks for sharing!!! - Anonymous
February 06, 2015
It doesn't bother me, Gary. Just found it a bit odd...
I see you've made an update in the meantime, so I'm going to try that out right away!
Maybe it's included now, but I don't see it in the details, but is there an easy way to exclude updates which are not deployed from these reports. We choose not to deploy a few updates, which skeps the result of course. Compliant means every single update is installed, so in our case a lot is considered not to be compliant.
I was looking in the XML source (v1.0 still at the moment) and noticed in the Software Update Information rdl:
CASE ui.IsDeployed
When 1 Then 'Yes'
Else 'No'
End as 'Deployed'
--> so you are doing something with the IsDeployed column, but I don't see it used anywhere else. Maybe it's a typo, cause I see a little lower in the where clause:
Where ui.IsSuperseded = 0 AND ui.IsExpired = 0 AND ui.IsExpired = 0
--> you have IsExpired twice. Maybe one of them should be IsDeployed??
Maybe it's just me, cause I'm not going to pretend I'm a big SQL query guru, nor expert at using the Report Builder. FAR from it! :-)
Anyway, thanks again for these reports. Importing v1.1 right away :) - Anonymous
February 06, 2015
First impression of v1.1: the results of the clickable columns don't match the number shown in the graph.
eg: in our test environment the graph shows 5 servers with +50 missing patches. When I click the bar and click View Report (without changing any of the parameters) I only get 1 server with 54 required updates.
So either the graph is wrong, or the report doesn't show all the details... - Anonymous
February 09, 2015
Thanks for sharing the report ...... - Anonymous
February 10, 2015
Thanks for clarifying, Gary. - Anonymous
March 08, 2015
Awesome, that´s what i am looking for. Very good design and very good reports. thanks a lot. :) - Anonymous
March 10, 2015
I tried adding a column for xp machines, it doesn't error out but its not pulling data. Can you provide what the query might look like for xp. I basically copied the other queries and updated them to reflect xp 5.2 etc... - Anonymous
March 25, 2015
I can't figure out how to get to the charts you show in "Seciton 3 - Compliance" - Anonymous
March 25, 2015
Never mind, I guess that's just the dashboard. - Anonymous
March 30, 2015
Great reports.
Just a quick question.
My reports aren't showing the numbers I would like to see, is there a way to change the collection/update group it is looking at to populate the graphs? - Anonymous
March 30, 2015
How did you calculate % compliance month wise? I am finding it hard to understand. Could you please elaborate on that. - Anonymous
April 07, 2015
Great reports Gary.
Thank you.
I'm having trouble understanding the chart 'Applicable Software Updates for Workstations' and how it calculates how many updates where applicable each month.
For example, in my case the month of March 2015 list:
224,211 'Security Updates Release or Revised Date' for Workstations, for a total of 11%.
When I click on the Mar-15 month for Workstations, and download the CSV, it list 44 security updates for March, not 224,211.
I did a little adding up in the spreadsheet, and it looks like it adds up all the rows listed in the 'Required' column. B/C if I add all the rows in the 'Required' column, i get a total of 224, 211.
What am I missing?
Thanks again for the great reports. - Anonymous
April 09, 2015
I'm having the same issue as Chris, but am otherwise extremely happy with these reports.
Great job!! - Anonymous
April 09, 2015
@Gary
I've read through your reply to Nico a couple of times, and I'm not able to figure out what subreport and what to change. Perhaps because English is not my native tounge, perhaps because my report builder skills certanly isn't something to brag about. - Anonymous
April 13, 2015
Yes it seems that way. It's not really a problem, I just thought it was supposed to show available updates for that month. - Anonymous
April 21, 2015
This is outstanding.. I am having an issue when I try and access data from one of the hyperlinks from within the dashboard. The item '/Software Updates Compliance/Software Updates Compliance - Software Update Information' cannot be found. (rsItemNotFound) any ideas? - Anonymous
April 21, 2015
Upon further investigating... I am seeing quite a bit of missed patches. When I try and drill down to the patch level I get the following.
The item '/ConfigMgr_SI0/Software Updates - A Compliance/Compliance 2 - Specific software update' cannot be found. (rsItemNotFound) - Anonymous
April 23, 2015
Thank you sir for responding.. I have done this and still getting that error. - Anonymous
April 23, 2015
Let me clarify. I can use the drill downs. When I am looking or I want to look at a patch that is not installed I get the error that I mentioned. - Anonymous
May 19, 2015
I am just curious how this data is being selected. Generally when i run a compliance report i run it by collection and Software Update group. I am just wondering because the reports that i see from this dashboard only show 41% compliance but when i run a compliance report by update group and collection it shows % compliance. Appreciate the reply - Anonymous
June 03, 2015
Not bad reports - but i can't find (anywhere) a report that shows compliancy as list beside an asset - its either overall compliancy per collection or auth list or an individual system.
i may use your reports - i would update the graphs to be a little more rb3...but thanks!! good work!! - Anonymous
June 04, 2015
This is very nice, thanks for all the effort and sharing.
I looked at the report Software Update Compliance – System Information. This is the only thing I need with some small adjustments. Hopefully you can help me with this because my SQL query and report building skills are not very good.
Instead of selecting in OS, I would like to be able to select a collection. This collection will have servers with different operating systems installed.
The other thing is that I don't want to select the update classification but a "Software Update Group". If possible to be able multiple software update groups.
This should make the same nice result but for only clients which are member of my collection and for those clients only the compliance state of the updates I'm deploying so which are in the Software Update Group.
Probably it's not a small difference after all but hope you can help me with this. - Anonymous
June 04, 2015
Ronald,
What you're asking for has been a requested by many people (some are in the comments of this blog) and something I plan on creating. It is nearly a complete rewrite to this dashboard as this wasn't intended to work with collections or SUGs.
You could use this query as a starting point. You will need to manipulate the JOIN if you want to change what update is queried on (e.g. By Category, Severity, Date Released, etc) or include additional information found int the System Information report.
select ai.Title, uspc.NumTotal [Total], uspc.NumPresent + uspc.NumInstalled [Installed], uspc.NumMissing + uspc.NumPending + uspc.NumFailed [Missing], uspc.NumUnknown [Unknown], uspc.NumNotApplicable [Not Applicable]
from [dbo].[v_UpdateSummaryPerCollection] uspc
JOIN v_AuthListInfo ai on uspc.CI_ID = ai.CI_ID
where ai.Title like '%Rollup%' AND uspc.CollectionID = @ColID
Change %Rollup% to a name of your SUG (or parameter) and @ColID to a match a Collection ID. Since you just want the data returned in a table format you could run this in SQL Management Studio or Excel.
You could also look into the SCCM Reporter from Silect Software. http://www.silect.com/products/sccm-reporter. It might be able to do what you're looking for. - Anonymous
June 16, 2015
Dear Gary,
would you please point out what would be good starting point (t-sql joist of certain views) in creating a custom report which would reflect the compliance 3 update group (per update) report. Additionally, the report would just show patch released date in addition to what is already in default report. All in all, that report still would refer to the certain update group that was deployed to the given collection.
many thanks in advance. - Anonymous
June 16, 2015
zedrick,
A good place to start is getting familiar with the Software Update views which can be found here:https://technet.microsoft.com/en-us/library/dn581945.aspx
If you were to dissect the Compliance 3 report you could see it is getting the SUG CI_ID from v_AuthListInfo then getting each update in the SUG from v_BundleConfigurationItems.
From there it is gathering information for each update from v_UpdateInfo and v_UpdateSummaryPerCollection while filtering the results further by category and collection joining it to v_CITargetedCollection.
This is a simplified explanation of what it's doing and it is obviously doing more that but should lead you in the right direction depending on your TSQL. - Anonymous
July 09, 2015
Hi Gary,
thanks for the reports.. its really nice and helpful.
i just need a help from you. i want to create a report where i can get the information of missing updates from each systems per Software update groups.
how can i achieve this? - Anonymous
July 19, 2015
Thanks so much for these reports, really well worth it - Anonymous
July 20, 2015
Hi Gary,
After playing with these reports for a bit I found that the sub-reports linked to were not using the categories selected in the main Dashboard so in addition to updating the path to the report in the action field, I added the Category parameter to run the report and set the value to =Parameters!Category.Value(), I then set the Category parameter to No Default value in the sub-report and it all works a treat now.
Thanks again for these reports, very valuable - Anonymous
July 29, 2015
Now that Windows 10 has been officially released I plan on updating this dashboard. I also plan on creating one to work with SUG's and collections however, it'll take a bit longer to create that one. - Anonymous
August 05, 2015
Thanks ...Thanks and only Thanks. Waiting for newer version of this report - Anonymous
August 07, 2015
Hi I am new to SCCM , Could you please share the step by step way to create the report , It will help me to deploy at my environment as well, Thanks. - Anonymous
August 07, 2015
@Sanjay - I'm sorry but I can't create a step by step guide for this report as it would turn into a small book. I do try to keeps things as simple as possible especially in the queries so you don't need to be an expert but do have to have some experience with TSQL and SSRS. Some things could have been done better but it'll become more complex.
You can check out my previous blog on a step-by-step guide for creating a SSRS report for ConfigMgr. It'll give you some basic guidance on SSRS but you'll still need TSQL experience to create your own queries.http://blogs.technet.com/b/gary_simmons_mcs/archive/2013/12/09/creating-a-custom-report-for-system-center-2012-r2-configuration-manager-part-1.aspx - Anonymous
August 07, 2015
Thanks Gary for quick reply!!, Actuall I am looking for Patch complicane report for my infrastrucure. Looking for Number of server Installed, Number of server missined the pathces and overall % compliace for that month. Currenclt I am faceing challanger to export the report from SCCM. Can you please help me on this. Or suggest best approach to do this. - Anonymous
August 10, 2015
Can you get same report on basis of Collections. - Anonymous
August 19, 2015
At first, thank you for sharing this excellent report, it's very useful. Just a couple notes.
As already mentioned, on the main dashboard, the applicable software updates counter is not correct, you missed the distinct keyword from your count function.
On the asset subreport you have to modify the parameter for Windows 10 to make the filter work. Windows 10 is identified as Workstation 10 not as Windows 10.
The subreport for the applicable updates (software update information) are excluding the Workstation 5 versions but not Server 5. So the number of updates shown in the subreport is different than shown in the chart because Windows Server 2003. - Anonymous
August 20, 2015
Brilliant, Gary! Very useful indeed.
I've added a little Credit footer in every report, with your name and a n HTTP link to this blog. Thought it was appropriate. I wouldn't take credit for a report like this! :) - Anonymous
August 25, 2015
@Otto
As for the number of applicable updates, it was intentionally set to not be distinct per a customer request. As you have found, it can be changed to show just the unique updates.
I'll check out the other items you listed in my lab when I get a moment.
Please feel free to continue to provide more feedback either in the comments section or with the email link. - Anonymous
August 27, 2015
It would be great if "unmanaged" included device with out clients not just obsolete. - Anonymous
August 28, 2015
@No Client
If the device never received a client it will not have a scanned time and should not show up as a managed device. If the device did have a client but was uninstalled the device should be removed from the database as part of a clean up process. Overall this is better handled with admin processes instead of a report.
I'm interested to know what your scenario is. - Anonymous
September 23, 2015
Please review my previous blogs that led up to this dashboard:
http://blogs.technet.com/b/gary_simmons_mcs - Anonymous
September 30, 2015
Congratulations!!
This are great reports, i have been looking for some report like that, you read my mind.. Thank you! - Anonymous
September 30, 2015
Congratulations!!
This are great reports, i have been looking for some report like that, you read my mind.. Thank you! - Anonymous
October 20, 2015
Great post Gary!
I am interested to know how you added the filter to limit the results based on a computer name. I am creating a few dashboards and would like to filter the Computer Name and a few more columns. - Anonymous
November 10, 2015
Nice reports, I'm not so good at making these myself :) Though one thing I would find handy would be a drop down selector so you could choose all updates/deployed updates only/updates not deployed. Or to filter by type, we publish Java and adobe patches through a 3rd party tie-in and they show up in this report and the boss would like to be able to see how compliant on Java, how Compliant on adobe, how compliant on Microsoft etc. - Anonymous
November 12, 2015
Gary, If I run the report "Software Updates Compliance - System Information" directly I get results. If I select one of the devices (servers) I get an error: "An attempt was made to set a report parameter 'MachineID' that is not defined in this report. (rsUnknownReportParameter)" - Anonymous
November 13, 2015
I really like these reports and overall find them very helpful. I change I would like to see (and I'm no good with SQL queries myself) is a dropdown (or multiselector) for the Vendor or maybe deployed yes/no for the server/workstation sections. For example, the workstation team deployed a bunch of Java updates via SW addon, to all our workstations. The servers are now showing 50% compliance for the month those were deployed. Of course when you drill down you can see that those updates weren't deployed to the servers. Management of course doesn't drill down so it just looks like a big fail on server updates that month. - Anonymous
December 18, 2015
Great Stuff..
I am trying out these reports but not able to see any graphs coming up. its blank. i just see the Server & Workstations at the top. - Anonymous
January 06, 2016
My graphs come up blank on dashboard as well, I read through your original blog and this blog and did not see a setting for this, am I missing something? - Anonymous
January 08, 2016
@David and Dave
It is possible to filter out updates but you'll need to go into each dataset and modify the queries. If you're comfortable with TSQL it shouldn't be too difficult. It'll take too long to explain how to do this in a blog comment.
Perhaps my other report using SUG's might be a better way to go so you can report on SUG compliance?
For the people having blank dashboards, would you mind listing the Operating System hosting SSRS, SQLSSRS version, the Operating System used to access the reports and the browser?
I just downloaded the reports, placed them into a lab with Server and SQL 2012 using Windows 8.1 with IE11 and they came up fine. I'll try a system with Win 10 when I can get it up. - Anonymous
January 14, 2016
You state that these report don't rely on SUGs, collections, or unmanaged systems. So where does it get the baseline to compare to? Could briefly explain that? Is it being compared to All Software Updates, essentially everything that's been released, but then you state only what's applicable in your environment? How does it make that determination? - Anonymous
January 17, 2016
The comment has been removed - Anonymous
January 21, 2016
Hi, your dashboard is really good and helpful, two thumbs up.
But one question i have, when i reporting on Security Updates i can´t see the Cummaltive Security Updates?
Is it easy to fix or is there a special reason.
with best regards and thx. :) - Anonymous
January 22, 2016
Sorry, i find it out. the cumalative updates was superseded and then i doesn´t saw him in the last month view.
so it runs fine and really good. :) - Anonymous
February 04, 2016
The comment has been removed - Anonymous
February 23, 2016
Great Reports. Saved me a LOT of work!
I am having only 1 problem. Niether of the 'Overall Compliance' graphs are displaying any data. where can I look to find out why? - Anonymous
April 20, 2016
Hi Gary,
Can you please provide some details on how to filter the results based on Collection?
Thanks - Anonymous
April 22, 2016
Excellent work and thanks for sharing. In case I just want the report for workstation and OS only, no servers involve in the dashboard report, how could I modify it?