Note
Access to this page requires authorization. You can try signing in or changing directories.
Access to this page requires authorization. You can try changing directories.
These graphs show what test iterations are stored and reported in the results of a Visual Studio load test based on the load pattern and warmup used. It is important to note the following things when considering the results:
- If the test's active run settings is set to store "All Individual Details" then all iterations are stored in the various "Details" tables regardless of whether they are reported.
- In the case of #1 above, the various "Details" tables have a column called "InMeasurementInterval." The iterations shown in Blue will have the value set to 1 and the iterations in Yellow will have a value of 0. Iterations in Red are not recorded.
- If the test's active run settings is set to store "Statistics Only" then the "Details" tables will NOT contain any information for the run in question.
- The summary information shown in the tables of a load test result page are calculated from the run details at the end of the run and are stored in Summary tables. These numbers will NOT include any of the iterations shown in Yellow below, regardless of which storage detail level was chosen.
The two graphs show two different test runs that drove the exact same load against the System Under Test.
- Each horizontal line (blue and yellow) represents a vUser executing a single iteration of the web or unit test. The Blue lines are considered "In the measurement interval" and are used for reporting. The yellow are not.
- The red line indicates the "apparent user load", meaning the load that the S.U.T. is experiencing. NOTE that the scale of the red line here is not exact. It is for illustration purposes only).
- The vertical dashed lines indicate the points in time that the test harness (Visual Studio) implements a "change of state" for the test.
- The first graph shows a run with a warmup time (first State), A Constant Load of 4 vUsers (second State), a cooldown time (third State), and the end of execution (any iteration in flight at the end of cooldown is terminated in flight and the results are not kept at all (shown in red below).
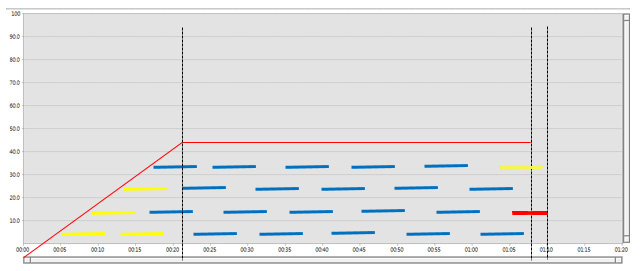
Graph showing a test with warmup and a constant load pattern. All iterations in blue will be reported. All iterations in yellow will not be reported.

Graph showing a test with no warmup and a step load pattern. All iterations in blue will be reported. All iterations in yellow will not be reported.
Comments
Anonymous
August 26, 2013
Thanks for the post! Item #4 was always something I wondered about but didn't have a good way to prove or disprove.Anonymous
August 27, 2013
Another thing I noticed with these is that if you set warm up or cool down, you will see these areas in the graphs while the test is running, but not when it is finished. VS also changes the Y-Axis markers in both cases as well. Which in fact is a little disconcerting :-)Anonymous
August 27, 2013
Ken, you are correct about this behavior for the x-axis. The graphs have to show something during the warm-up so people can monitor. However, it might be nice if the axis showed negative times counting down toward the start of the test. I do not recall seeing the Y-axis change when I have run tests. The ranges may change, depending on max values, but the scale is usually consistent at 0 to 100. Can you give an example of what you see and I can try to look into it?Anonymous
March 19, 2014
Visual Studio as a lod testing tool so far has been a great experiance. That is untill tring to build out scenarios, and understanding how to push my target load in a way that simulate a multi tiered load pattern. The question I have, which and have not had a chance to test out myself. While using X iterations per vUser option with 32 vUsers and 32 scripts will the harness assign one vUser per script every time? Secondly if I use a step pattern in the same case where I add 32 users initialy, and 32 more users for each step, will it distribute evenly among the scripts?Anonymous
March 19, 2014
Edit: Visual Studio as a load testing tool so far has been a great experience. That is until trying to build out scenarios, and understanding how to push my target load in a way that simulates a multi-tiered load pattern. I have and have not had a chance to test this out myself. While using X iterations per vUser option with 32 vUsers and 32 scripts will the harness assign one vUser per script every time? Secondly if I use a step pattern in the same case where I add 32 users initially, and 32 more users for each step, will it distribute evenly among the scripts?