Visualizing Common DirectX Performance Problems with GPU Usage in Visual Studio 2015
With the upcoming release of Visual Studio 2015 Update 2 we’ve been hard at work adding some new features and fixes to the GPU Usage tool. For those not familiar, the GPU Usage tool is used as a lightweight capture tool that gives information about the relative workload on our CPU and GPU while running a DirectX game, as well as information about how long it takes for each DirectX call to execute on the GPU.
The GPU Usage tool puts a lot of data out there, so I wanted to make a bit of a guide for how to diagnose and investigate some common performance issues with DirectX applications.
Running Well
Before we get into looking at performance problems we need to know what our baseline would be for an application that is running well. For my sample program I’m using the MiniEngine provided by a team down the hall here at Microsoft. The cool thing about MiniEngine is that while it’s basically a full blown game engine it’s also small enough to have a pretty full grasp of and it’s easier to make interesting tweaks and experiment on the code.
After starting up the ModelViewer project that is included with MiniEngine I’ve used Alt-F2 to start up a diagnostic tools session on my project. Turning on GPU Usage and running for ten seconds or so collected a log like the below.
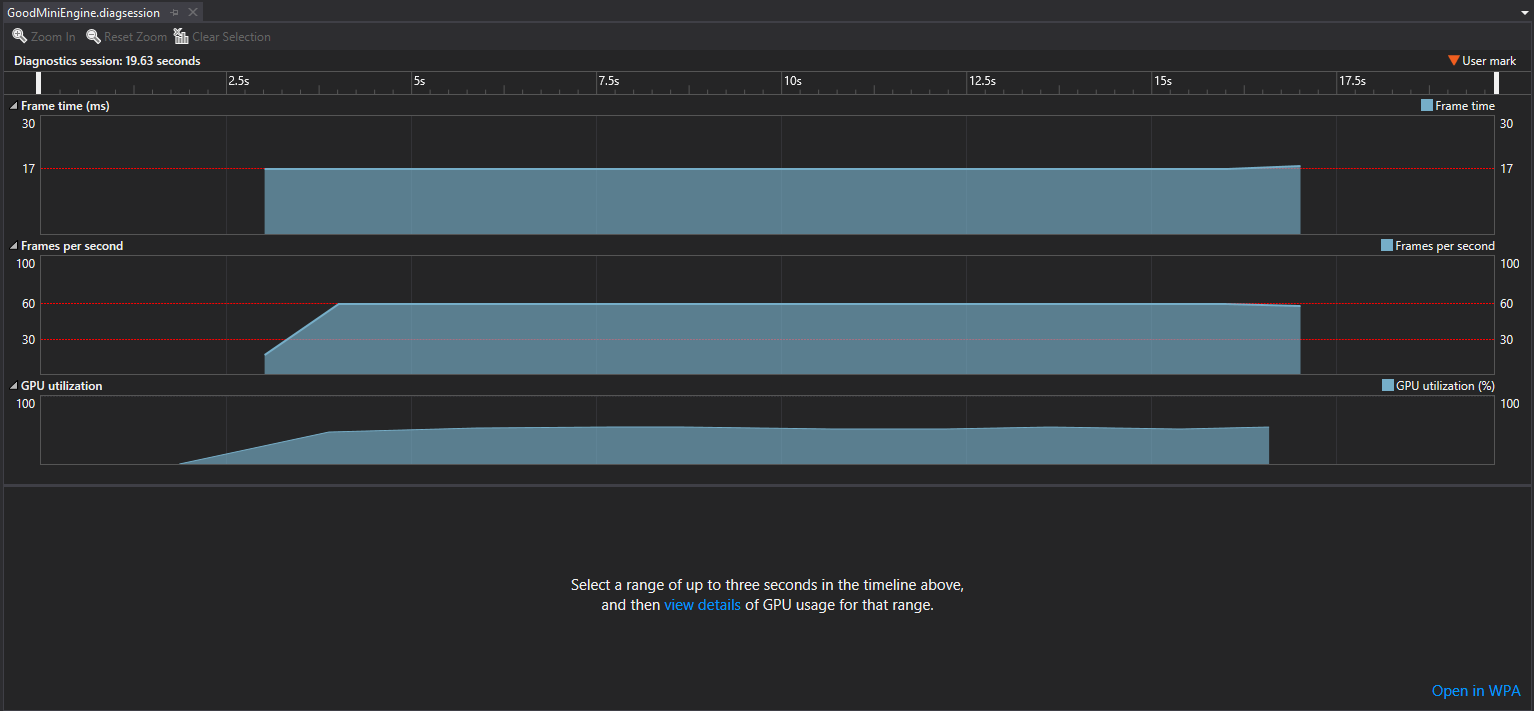
From this overview it’s pretty easy to see that this application is running just fine on my system. Frame rate is steady at 60 FPS and utilization of the GPU is hovering at about 50% or so. If we select a chunk of time from this log we can dig in closer about what good performance looks like.
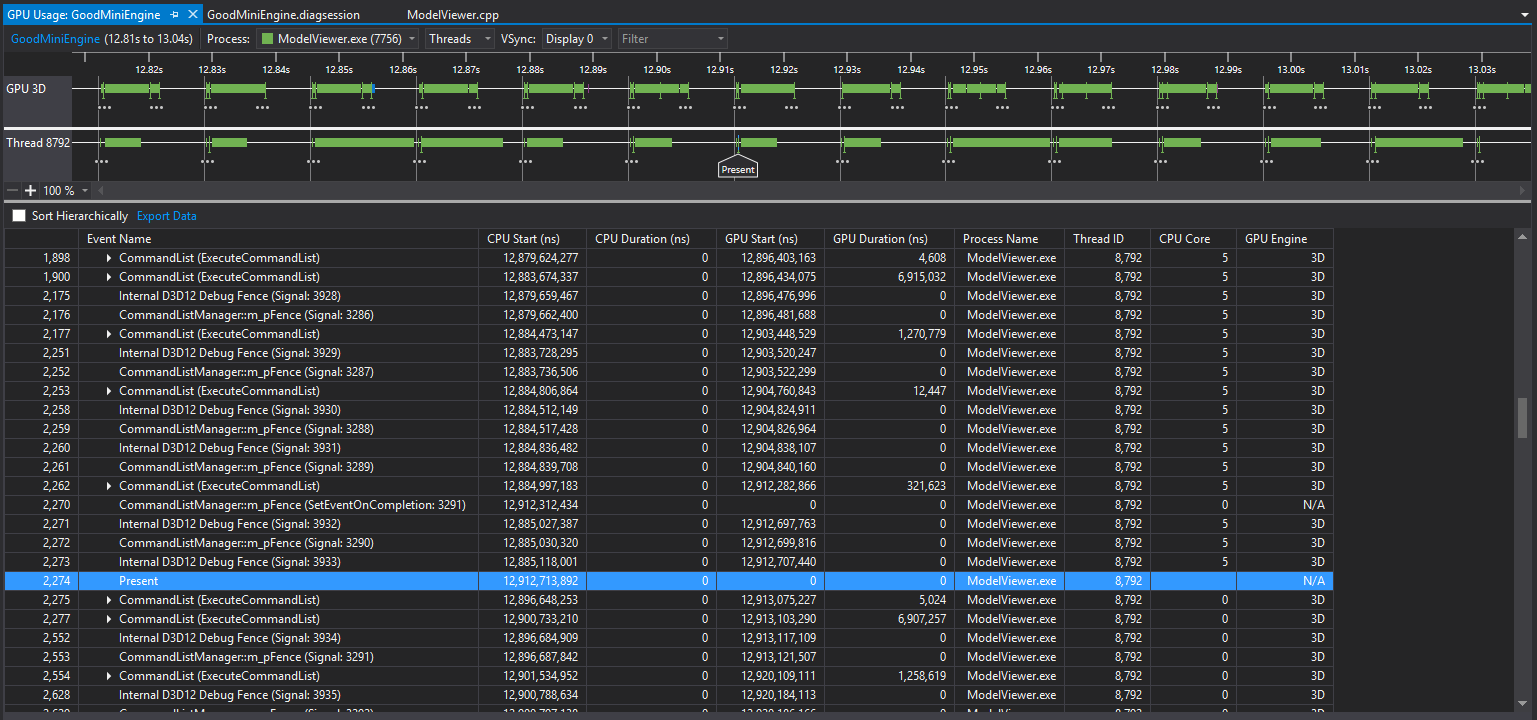
Note that in Update 1 we changed GPU usage to show a view that breaks down the profiling information by process and thread as opposed to the less useful core view that we used at Visual Studio 2015 RTM. If you ever need to see all the processes on a system, just select “All” from the Process dropdown and it will show you all the processes on all the different cores.
One of the first things to look at in the picture above is the thin grey lines coming down across the various timeline lanes. Those are the V-sync events from your monitor. To check out your frame rate you can just look to see if you are getting a present event into each frame that is being displayed to the user. The presents are represented by a “P” marker in each lane (which you might not see unless you zoom in closer). You can also just type “Present” into the Filter box at the top of the timeline control. Doing that will filter the list to just Present events and you can just arrow down through the events list to see where all the Presents fall.
In our example above we are fitting in all of our CPU processing and all of our GPU processing into the 16.6 or so milliseconds that we have to create each frame. As such, each frame comes out in time for the v-sync and we get that buttery smooth 60fps that gamers are looking for.
CPU Bound
So what does this look like when things are not running well? After some code tweaks a new log has been collected where the overview looks like this.
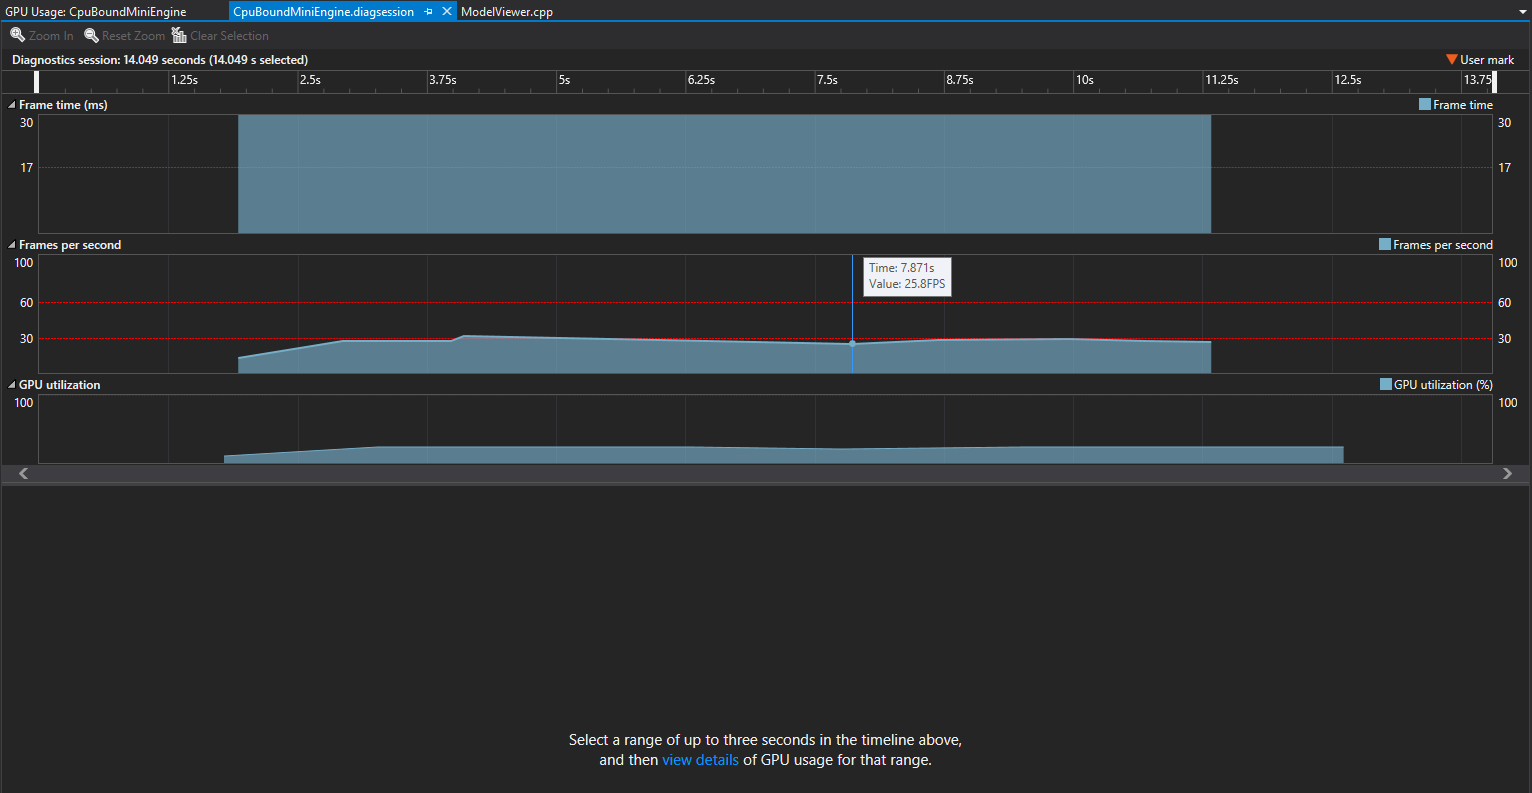
Our frametime is now off the chart, our FPS is wiggling around under 30 or so, and our GPU utilization has actually dropped. What we have here are the classic symptoms of CPU bound issues. Here our CPU has so much work scheduled on it that it can’t send commands to the GPU in a timely fashion. The GPU is stuck waiting around for work while the CPU spins madly. This imbalance is even more obvious if we zoom into the detail page.
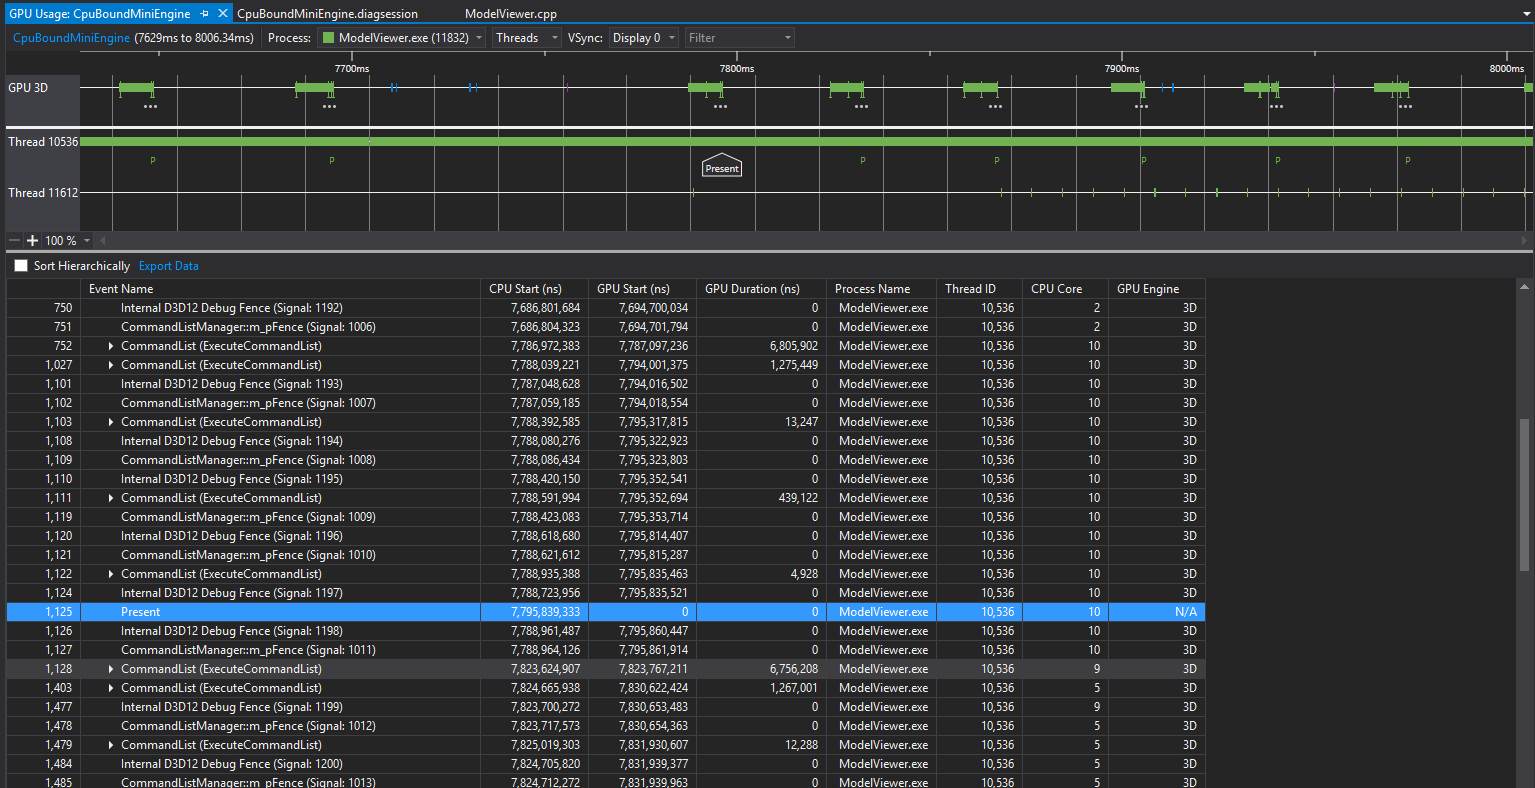
In the GPU lane chunks of work are about the same size as in the running well scenario. But in the CPU lanes we now have one thread (which is issuing our render commands) that is totally booked on the CPU. The Present calls are getting spaced out of the v-syncs so we are dropping frames and our game is starting to look pretty choppy for players. Note that the couple of small blue ticks on the GPU 3D line are actually devenv.exe, the Visual Studio process, doing a bit of work on the GPU.
When we know that we are dealing with a CPU bound issue we need to look at how we are spending our time on the CPU. Part of this could be profiling non-graphics related CPU work that the application is doing to reduce the time spent there. Or if using something like DirectX 12 there is a much better ability to break up rendering code across multiple threads with command lists to keep the CPU busy submitting work to the GPU.
One of the nice things about the integration of GPU usage with the other Visual Studio diagnostic tools is that you can run the different tools in concert with each other. Our GPU usage tool simply shows what threads and processes are active on the CPU, but nothing about what was actually going on in those sections of time. Going back to the diagnostics tools page (Alt-F2) I can select both GPU and CPU usage and run them both at the same time.
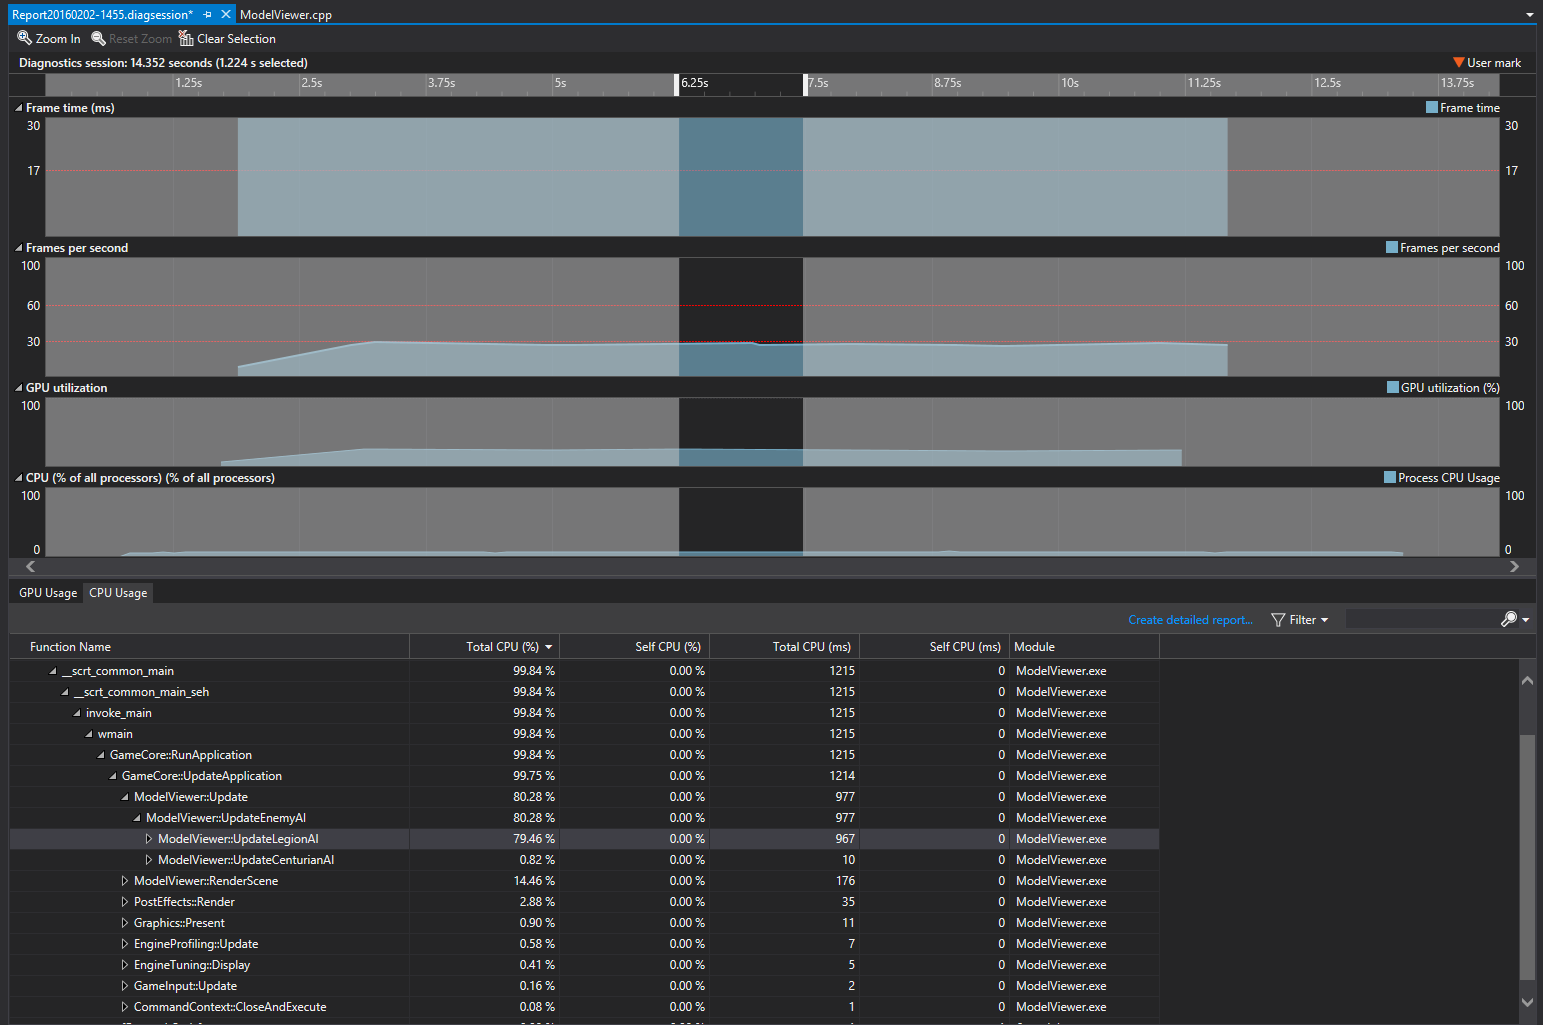
Now over the same period of time that I’m looking at GPU Usage details for I can also look at what was happening on the CPU. Looks like a massive amount of time was being spent in AI processing for one specific enemy type during my per-frame update stage.
GPU Bound
Pictured below is another run of MiniEngine where midway through the run I kicked up some of the settings. From the overview it’s clear to see where our performance dropped from 60 fps down into the 30 fps range and with this run we see a corresponding uptick in GPU utilization.
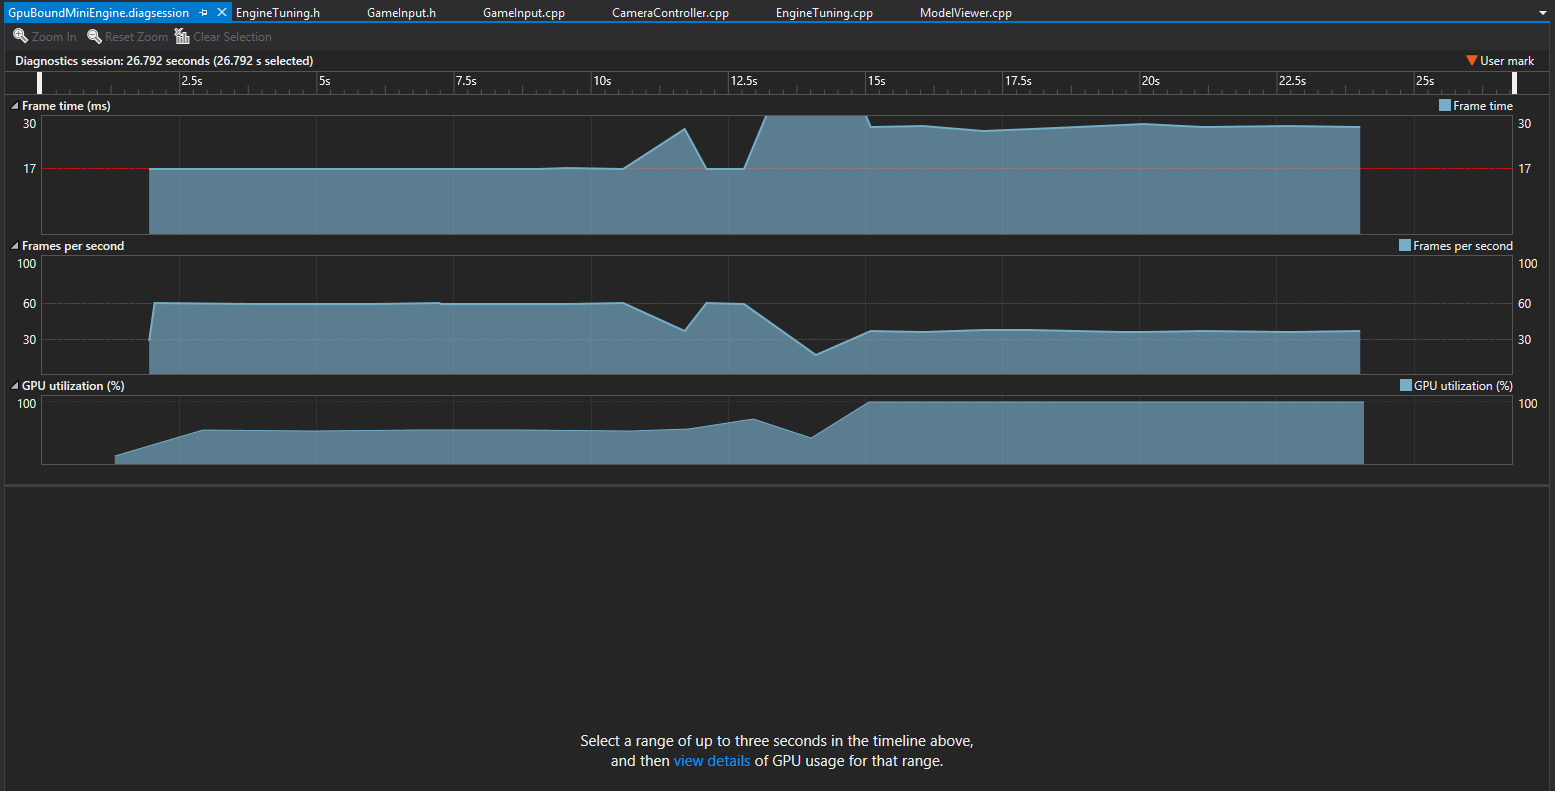
The performance hit can be seen easily in the overview, but what is actually causing this performance change? In a situation like the above it can be nice to open two different details sections, one from when the application was performing correctly and another from when it was not.
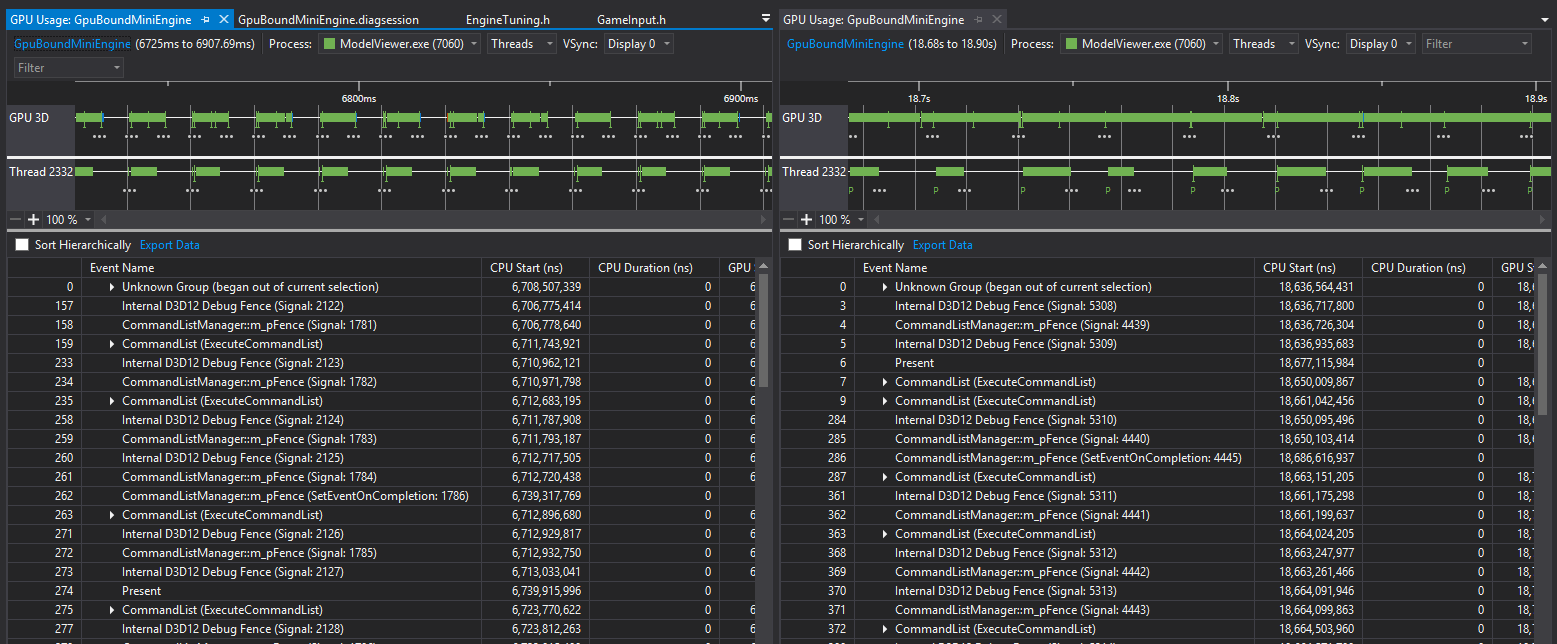
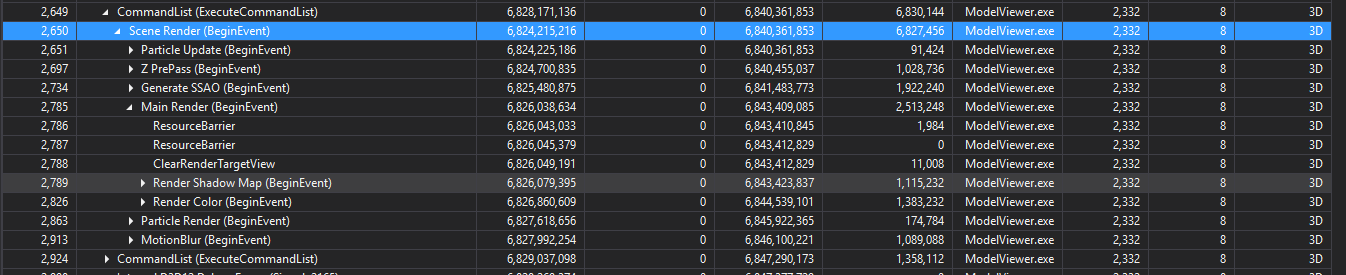
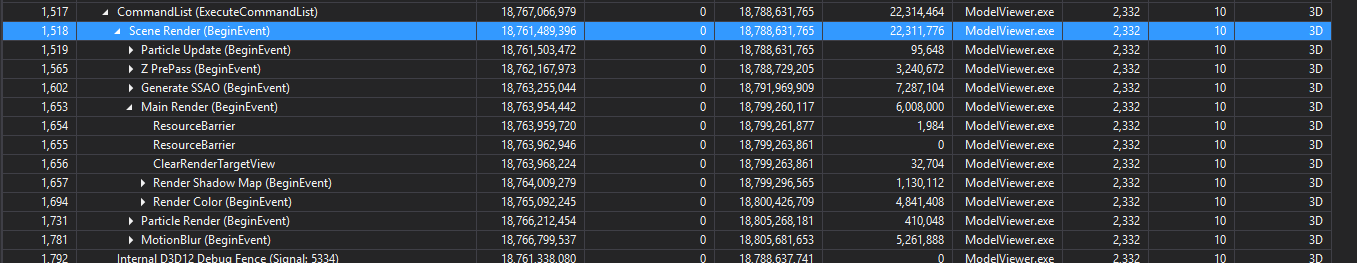
On the left we can see the chunks of GPU work fitting into each v-sync. Meanwhile on the right the GPU lane is totally full and the Present events are not hitting each v-sync interval. Helpful, but at this point we could get much of the same information from a simple FPS counter. To make this comparison more useful we can dig into the blocks of GPU Usage in the timeline or into the Events list to figure out where are time is being spent on the GPU more specifically. The DirectX events in the events list initially will only show up in a big flat list, or grouped by CommandList in DirectX12. It can be very tricky to navigate to what each call is doing in a big list like this, so to get the most out of GPU Usage it’s best to add some well-placed marker events into your code. When these events are hit on the GPU, GPU Usage will group them hierarchically in the UI and roll up the durations for the DirectX events that they contain as in the examples below. For DirectX11 look at the BeginEvent API and for DirectX12 look at the PIXSetMarker API. With the hierarchy you can drill down into the time spent in different areas of rendering code.
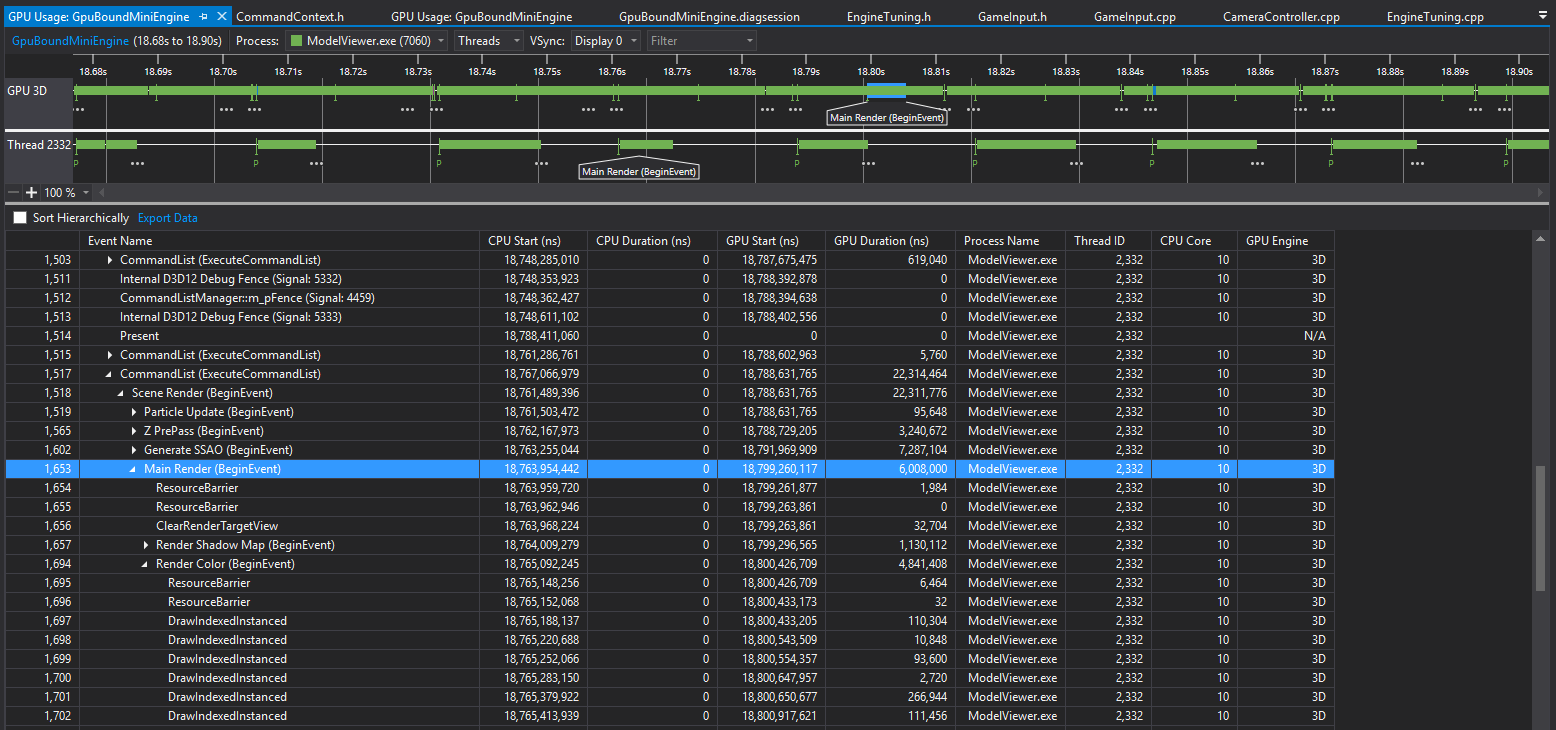
In the example above we are showing the amount of time spent in the Main Render section of MiniEngine rendering code. As we select events or groupings in the event list the timelines at the top will update to show the amount of time for that event, we can also see in the CPU lane when that event was called from the CPU, so you can see delays that happen from when the API is called on the CPU to when the GPU queue actually gets around to executing that code.
By looking at the good and bad sections with annotated code can make it trivial to pick out performance issues caused by changes in code or assets.
If navigating the event list gets hard using the filter options and column sorting can help to tweak what you are seeing. Pictured below is all the instances of the “Decompress and downsample” event grouping sorted by GPU Duration as opposed to when they were executed. 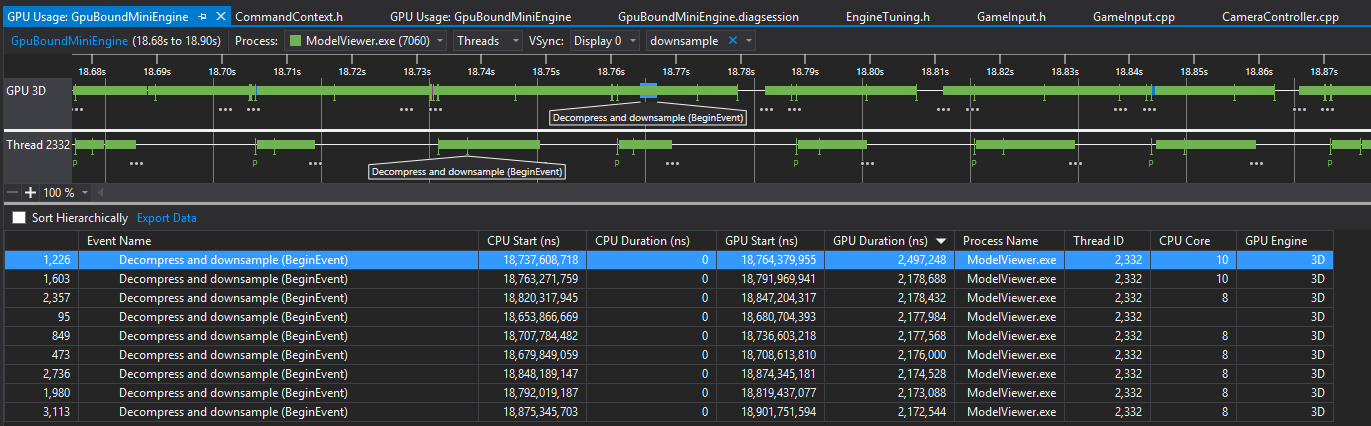
In further entries I'll be looking into a few other new features added in Updates 1 and 2 for the GPU Usage tool.