Note
Access to this page requires authorization. You can try signing in or changing directories.
Access to this page requires authorization. You can try changing directories.
In a previous post I showed you how you can add telemetry to your bot. The sample code linked on my blog allows you to send key/value pairs from anywhere within your bot API to Application Insights. Also, I showed how you view the tracked data in Application Insights Analytics. What I didn't show however, is how to extract meaning from the telemetry using Analytics syntax.
So let's say you have the following in your code to track which channels your bot is being used on:
 if (activity.Text.Length > 0)
{
   var properties = new Dictionary<string, string> { { "BotQuestion", activity.Text } };
   if (activity.From != null)
   {
      properties.Add("Name", activity.From.Name);
      properties.Add("Channel", activity.ChannelId);
   }
   telemetry.TrackEvent("BotQuestion", properties);
 }
In Analytics this will show as this:
[caption id="attachment_1715" align="alignnone" width="300"]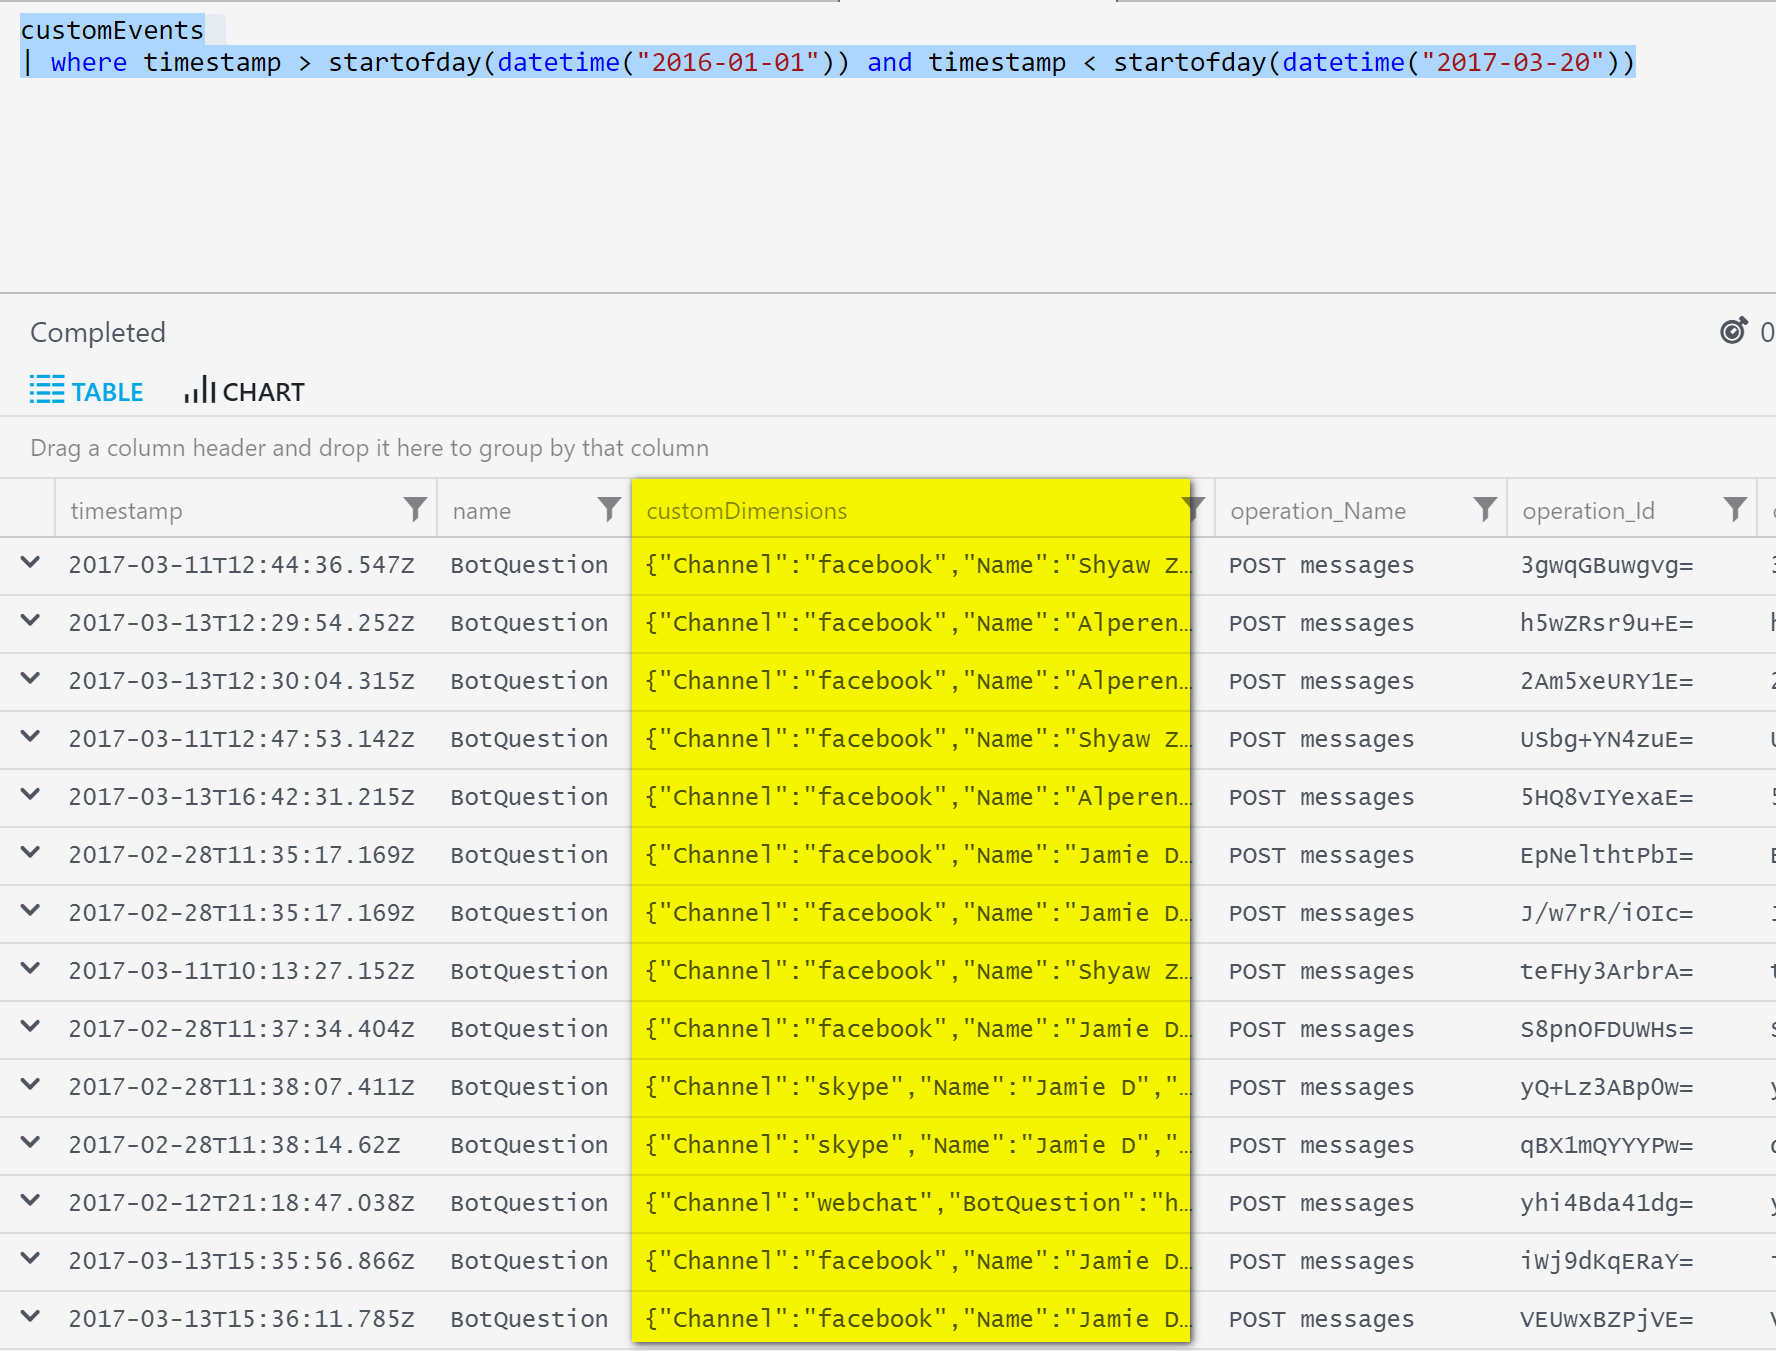 customDimensions (from TrackEvent call in Application Insights)[/caption]
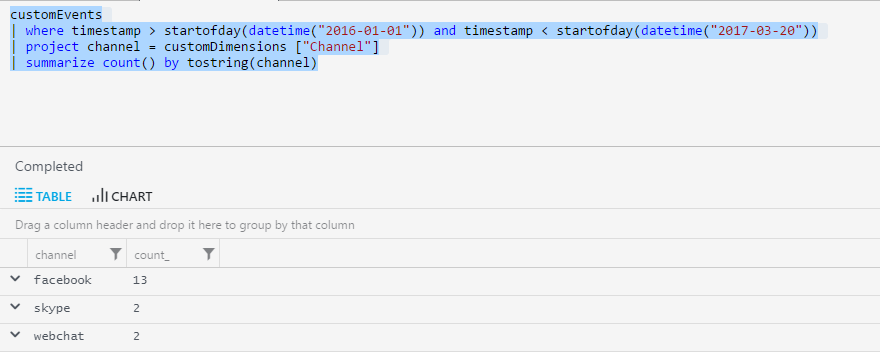
You'll likely want to extract the values from customDimensions so you can do something useful with them. Luckily, Application Insights has a powerful Analytics query language that we can leverage. From the above sample code, the following query will allow you count the number of events by channel - ie. to find the most popular channel your bot is being conversed on, which is especially important if you are targeting one or more channels.
Here I project the customDimensions["Channel"] to return the singular field and then group by the channel name:
 customEvents
| where timestamp > startofday(datetime("2016-01-01")) and timestamp < startofday(datetime("2017-03-20"))
| project channel = customDimensions ["Channel"]
| summarize count() by tostring(channel)
This returns the following:
Within AI Analytics itself you can render charts as well as tables, but it also has a great feature which allows you to export the corresponding PowerBI query of this data - which gives you fine control to create more advanced dashboard scenarios where you can pull data from different resources or display multiple queries in a single pane.
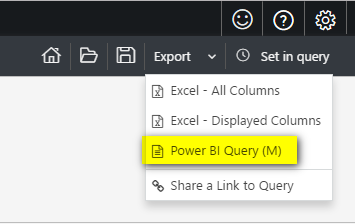
This option downloads a text file containing the Power Query Formula Language (M Language) which can be used in either Excel and/or Power BI Desktop. The text file itself will not only contain the query but details of how to add it to Power BI Desktop:
1. 'Get Data' -> 'Blank Query'->'Advanced Query Editor'
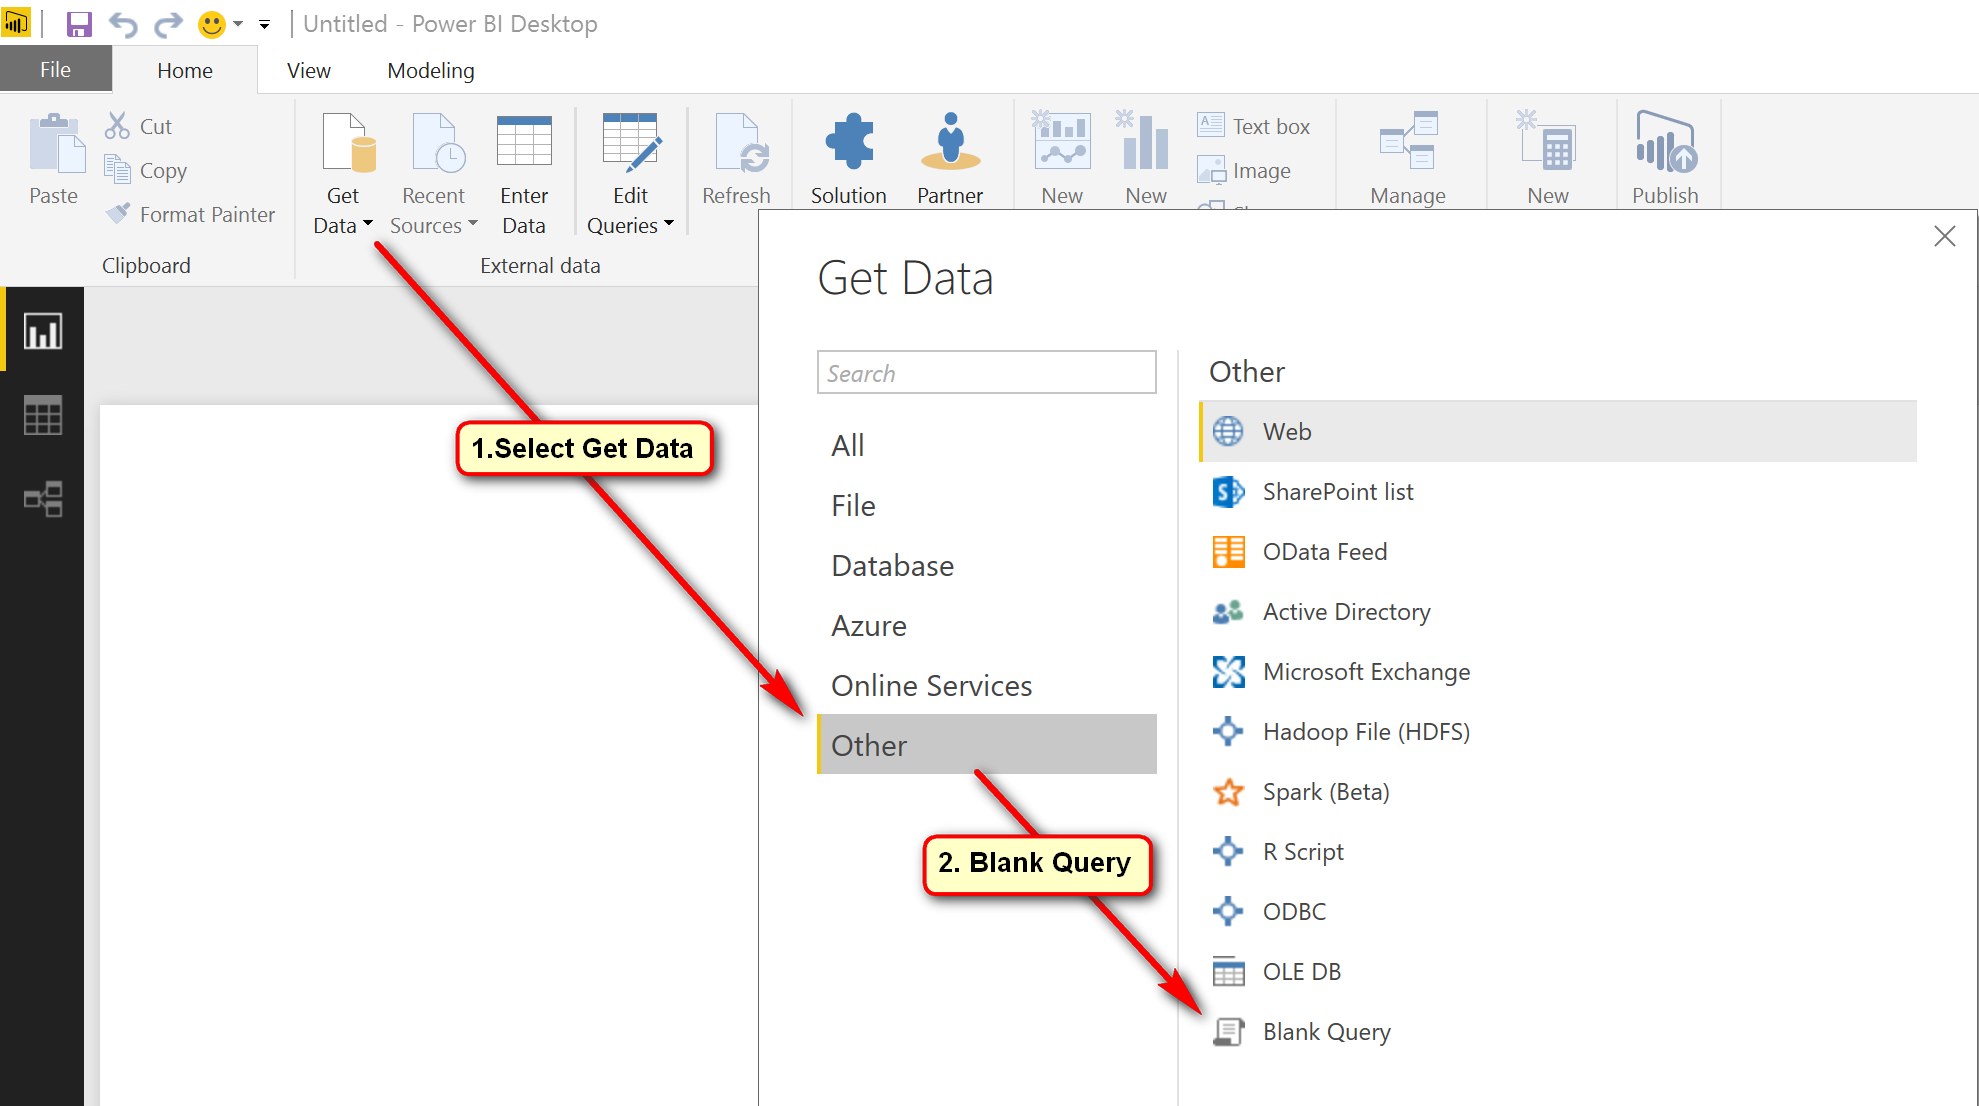
2. Open the Advanced Query Editor and paste the M Language script with it and select Done.
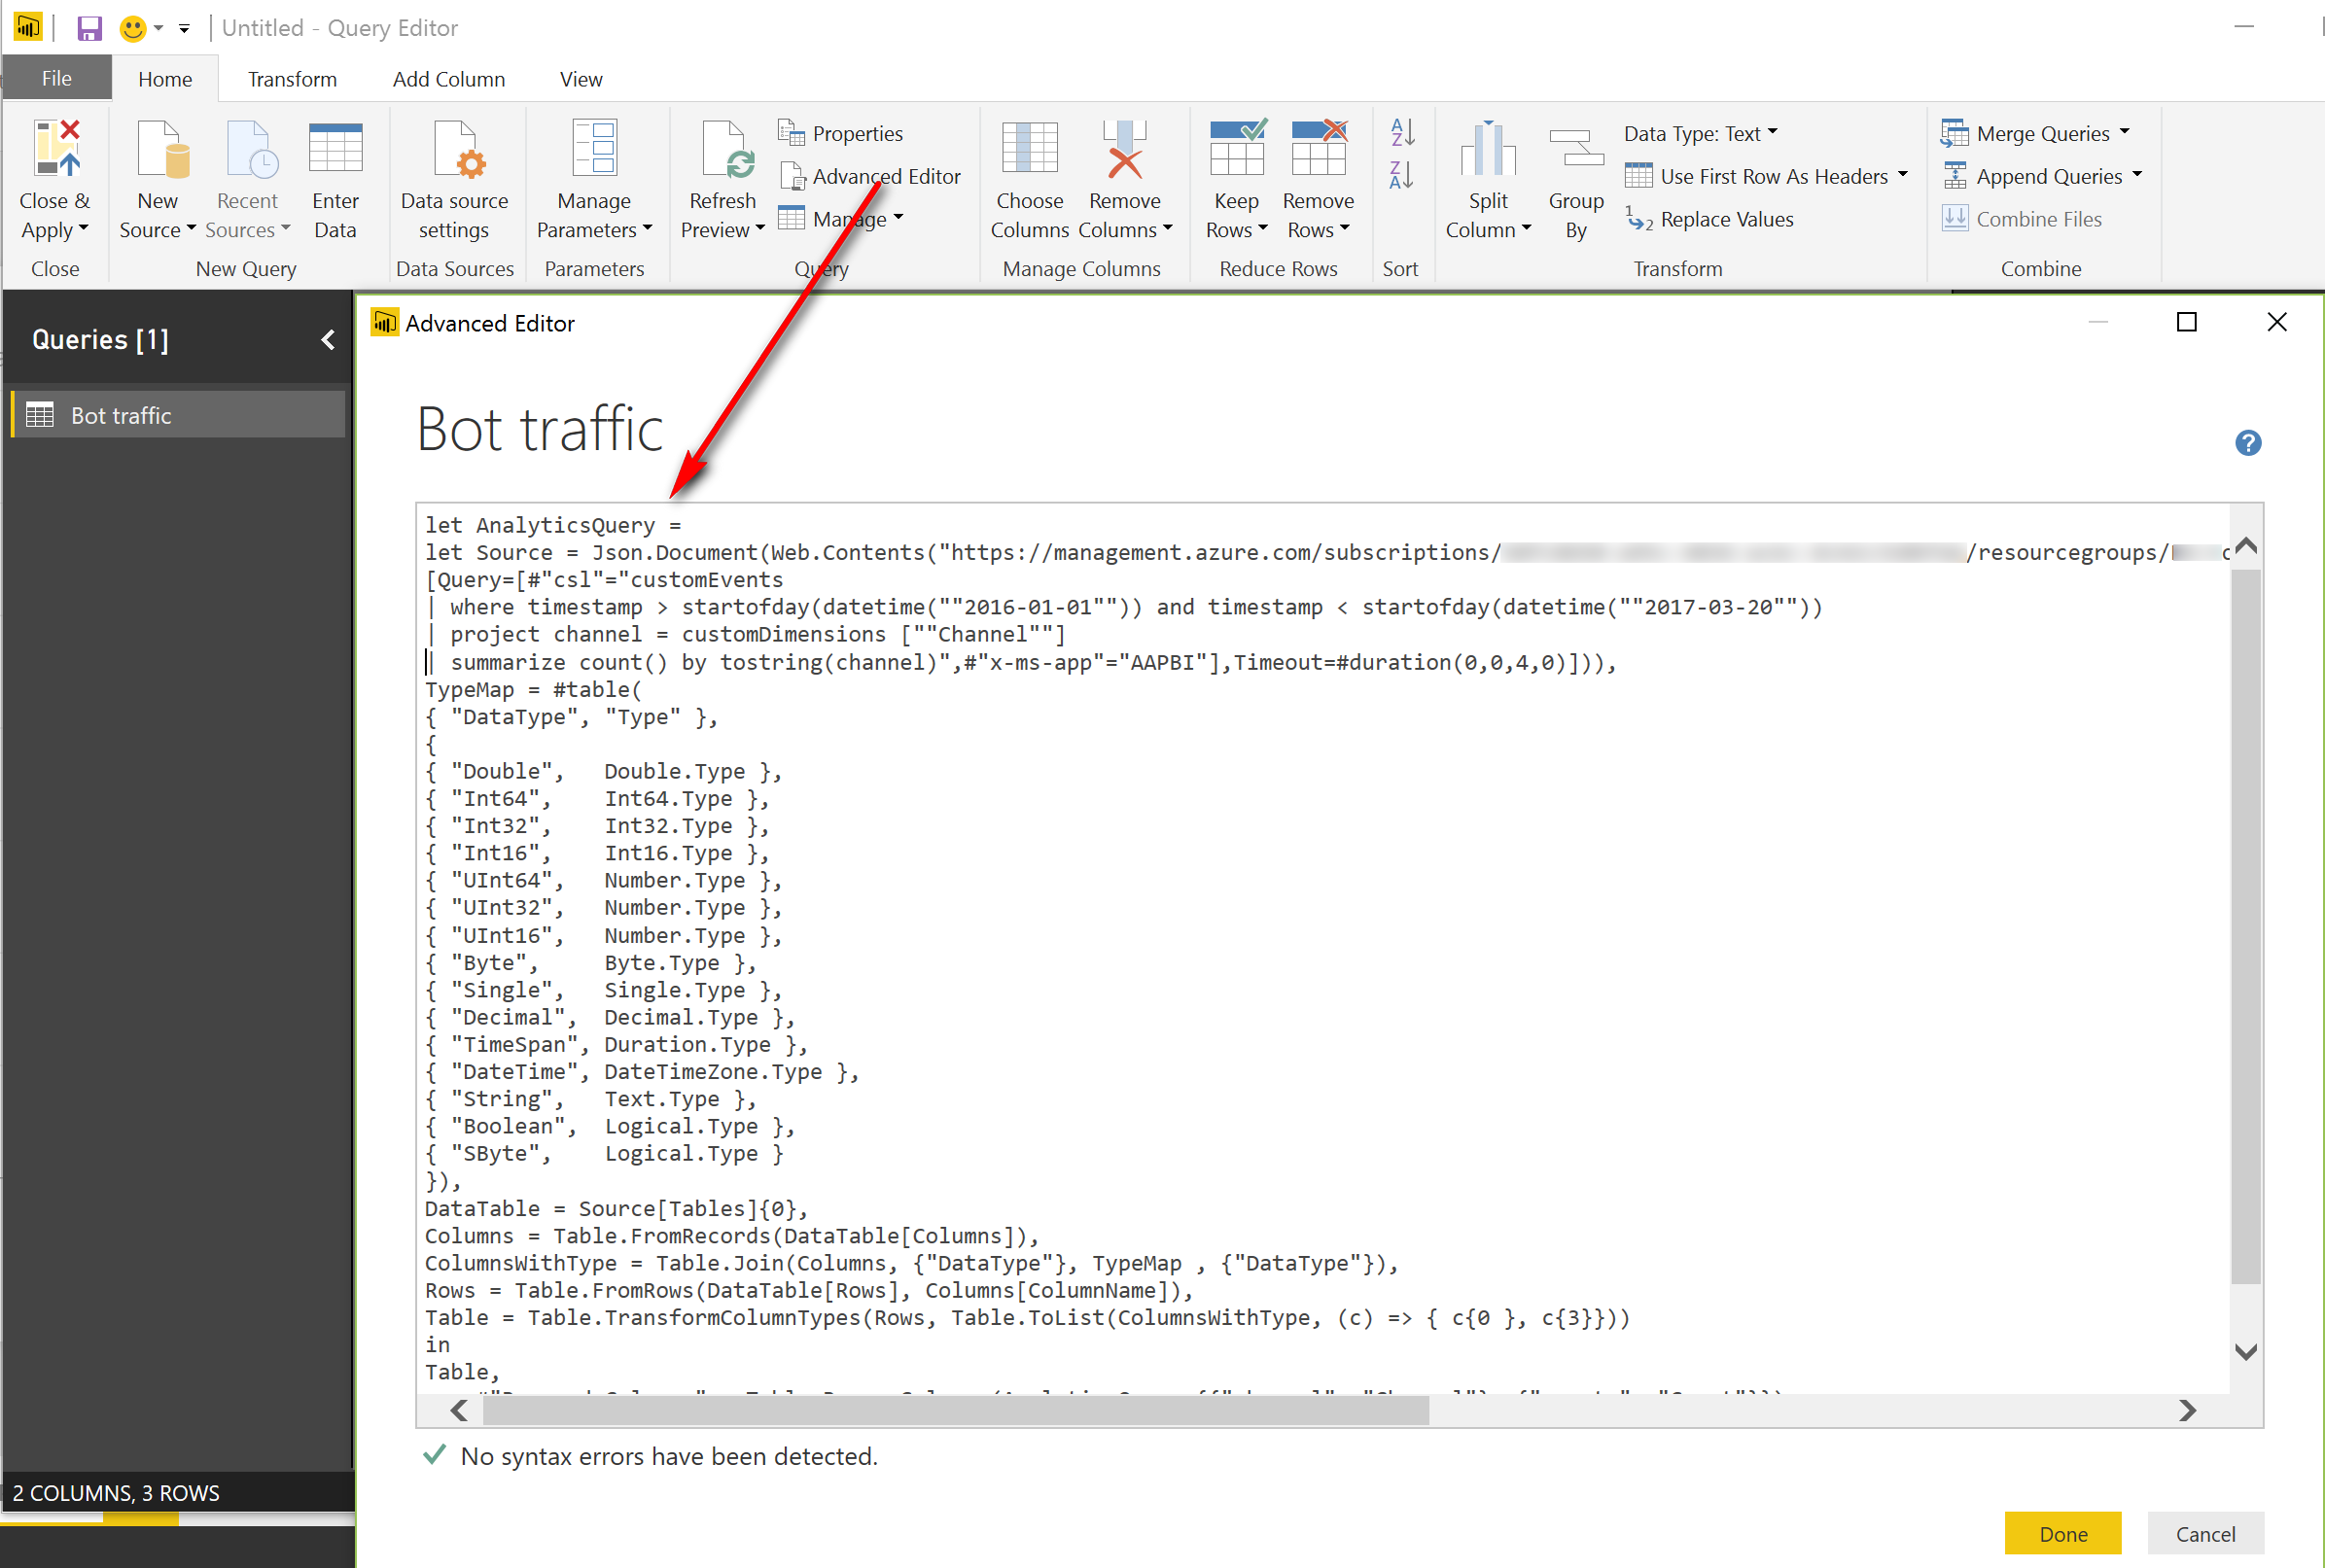
The M Language will look similar too the following:
 let AnalyticsQuery =
let Source = Json.Document(Web.Contents("https://management.azure.com/subscriptions/{someguid}/resourcegroups/{someresourcegroup}/providers/microsoft.insights/components/{someendpoint}/api/query?api-version=2014-12-01-preview",
[Query=[#"csl"="customEvents
| where timestamp > startofday(datetime(""2016-01-01"")) and timestamp < startofday(datetime(""2017-03-20""))
| project channel = customDimensions [""Channel""]
| summarize count() by tostring(channel)",#"x-ms-app"="AAPBI"],Timeout=#duration(0,0,4,0)])),
TypeMap = #table(
{ "DataType", "Type" },
{
{ "Double", Double.Type },
{ "Int64", Int64.Type },
{ "Int32", Int32.Type },
{ "Int16", Int16.Type },
{ "UInt64", Number.Type },
{ "UInt32", Number.Type },
{ "UInt16", Number.Type },
{ "Byte", Byte.Type },
{ "Single", Single.Type },
{ "Decimal", Decimal.Type },
{ "TimeSpan", Duration.Type },
{ "DateTime", DateTimeZone.Type },
{ "String", Text.Type },
{ "Boolean", Logical.Type },
{ "SByte", Logical.Type }
}),
DataTable = Source[Tables]{0},
Columns = Table.FromRecords(DataTable[Columns]),
ColumnsWithType = Table.Join(Columns, {"DataType"}, TypeMap , {"DataType"}),
Rows = Table.FromRows(DataTable[Rows], Columns[ColumnName]),
Table = Table.TransformColumnTypes(Rows, Table.ToList(ColumnsWithType, (c) => { c{0 }, c{3}}))
in
Table
in AnalyticsQuery
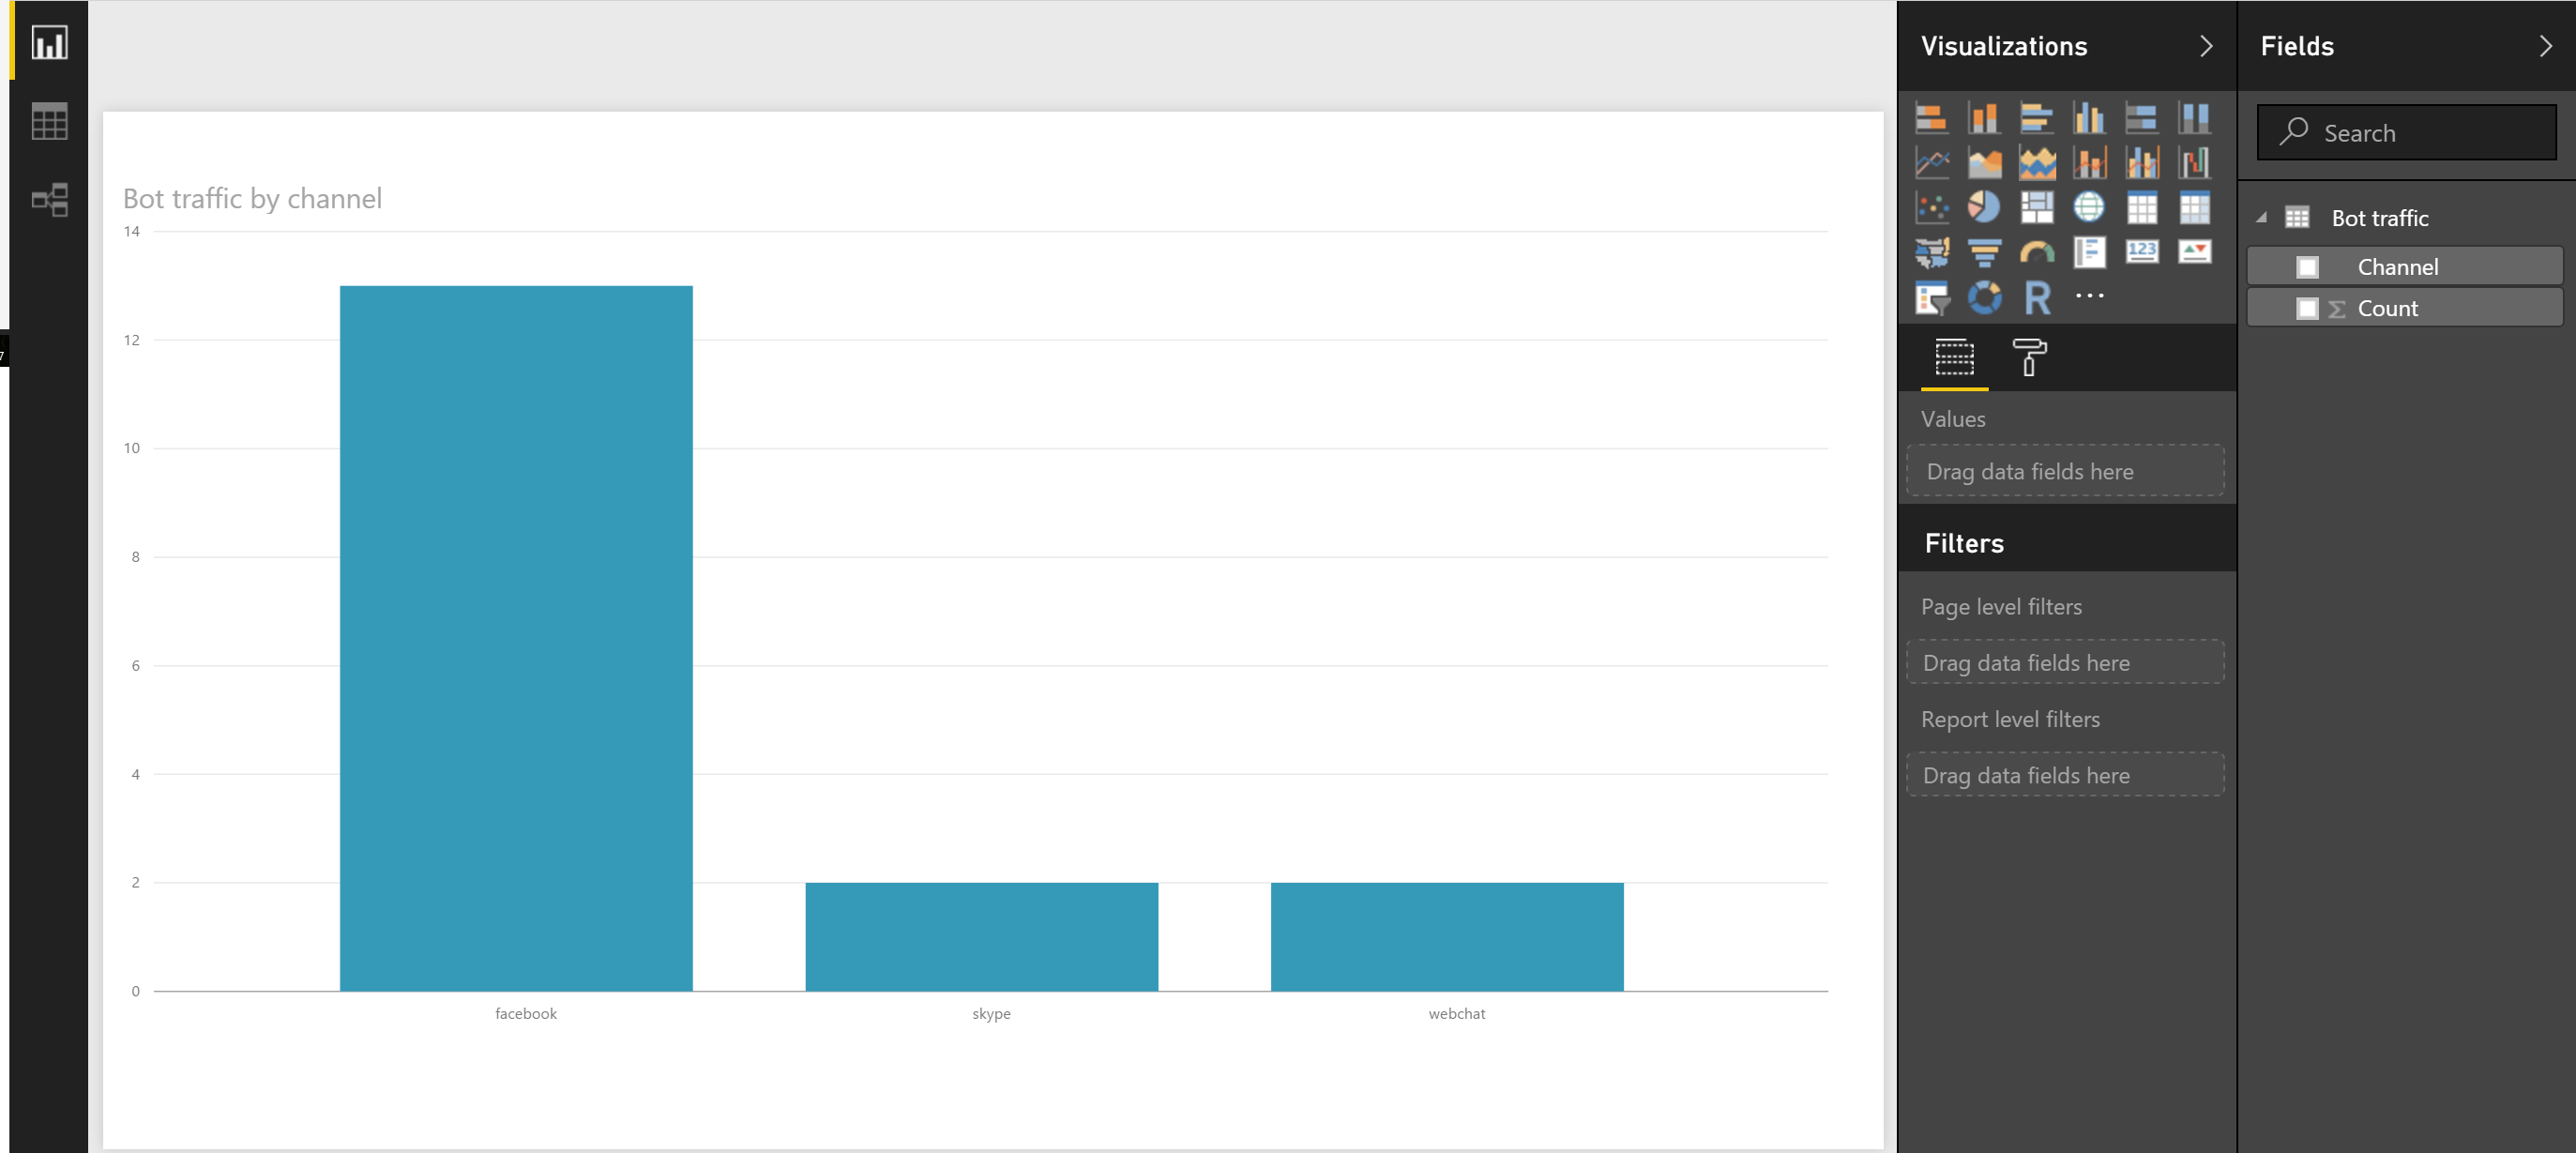
In PowerBI Desktop, once you have the data source setup, you can now configure the Visualisations/Filters and Fields to your hearts content :)