Tools Can Be So Much Fun PLUS Cluster Accuracy
For a project I was working on I had to create a lot of models and extract one piece of information from each of them for charting. Particularly, I wanted to see the impact of changing the cluster count of a clustering model vis-a-vis the model "score" which is stored in the content column "MSOLAP_NODE_SCORE".
To do this "the traditional way" - i.e. using the UI - i.e. the way I started - is arduous. Basically the process is like this
- Create a project, data source, data source view
- Create mining structure and initial model
- Add model to structure
- Name model
- Select clustering algorithm
- Close dialog
- Open algorithm parameters
- Set the CLUSTER_COUNT parameter
- Close dialog
- Rinse
- Repeat
What a pain! So after creating two of these - I stopped, took a breather and reapproached the problem.
I started over and created the project items in BI Dev Studio up to and including a Mining Structure with a cluster model which I called "Cluster0" and set the parameter CLUSTER_COUNT to 0. I then deployed and processed the model to my server from the project.
Next I used a trick I previously posted using the query editor in SQL Server Management studio to send multiple DMX commands. Using this technique I was able to quickly create multiple ALTER MINING STRUCTURE commands in the text editor and fix up the names and parameter numbers.
In the end I had a document that looked like this
ALTER MINING STRUCTURE [WBCD] ADD MINING MODEL Cluster2
USING Microsoft_Clustering(CLUSTER_COUNT=2)GO
ALTER MINING STRUCTURE [WBCD] ADD MINING MODEL Cluster3
USING Microsoft_Clustering(CLUSTER_COUNT=3)GO
ALTER MINING STRUCTURE [WBCD] ADD MINING MODEL Cluster4
USING Microsoft_Clustering(CLUSTER_COUNT=4)GO
...
I actually did this up to Cluster26 - why? Because that's how many times I pasted - that's why.
Next, I had to train the models, so I issued the command:
INSERT INTO MINING STRUCTURE [WBCD]
This statement executes a "Process Default" on the structure, which, since the structure was already processed, processes all of the unprocessed models within the structure. If you have Enterprise Edition, it also parallelizes the processing to speed up overall processing time. Actually, in practice, I put the INSERT INTO statement after the last ALTER to create and process the models in a single execution.
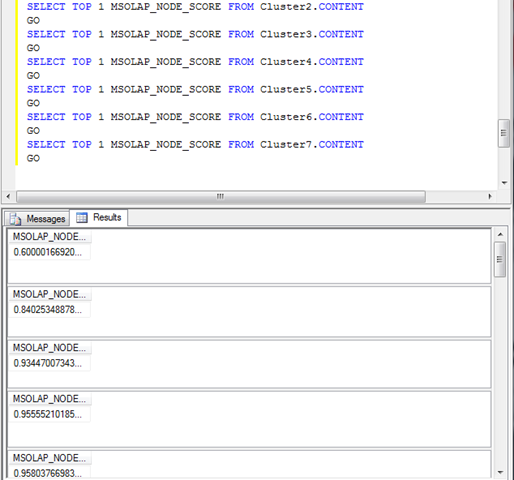
Finally I needed to get the bit of information from each model. The overall score for a cluster model is stored in the first row of the content so I just used the query
SELECT TOP 1 MSOLAP_NODE_SCORE FROM Cluster2.CONTENT
Simple enough - so then I used the "GO" trick as above to execute the statement for each model. However this resulted in 25 windows being created in SSMS with no way to select results from all the queries. Yuck! It looked liked this (after I manually resized all of the panes)
Needless to say, not very useful. So again time for reapproaching. So I though of those undocumented features of the Data Mining Addins I posted a while back (to be documented and supported in SQL Server 2008!) and made a plan.
I ran Excel with the Addins loaded and created a connection to my database. Then I typed "Cluster2" in a cell, and "Cluster3" in the cell below. I selected the cells and dragged down until I got to "Cluster26" (why? because that's how many times I pasted - remember?).
Next I needed to use the DMCONTENTQUERY function. The DMCONTENTQUERY function has the signature
DMCONTENTQUERY(<connection>,<model>,<content column>, [<where-clause>])
It has the semantic that it returns the first value the query returns - essentially creating a TOP 1 query like I issued from SSMS. So I entered in the neighboring column
=DMCONTENTQUERY("",A2,"MSOLAP_NODE_SCORE")
Leaving the connection name empty implies that it should use the current connection - since I was already connected, I was lazy and left it blank (many times I mistyped the connection since the form is "<database> (<server>)" and I always forgot the server - ugh!). "A2" is the cell that said "Cluster2".
I dragged that down the column and voila! I had a list of scores that I could easily plot! Mission accomplished!
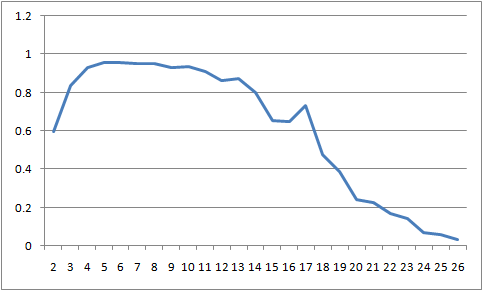
And for those of you patient to read this far - here's the resulting chart showing good models ranging from 4-10 clusters and then starting to drop off with an odd little spike at 17 clusters.