Note
Access to this page requires authorization. You can try signing in or changing directories.
Access to this page requires authorization. You can try changing directories.
If you troubleshoot day in and day out, you will deal with an amazing amount of data. Because, to find out the cause and get to the bottom of the issue, we look into lot of places. For example: IIS Logs (If we are troubleshooting issues related to websites hosted in IIS), Windows event logs, Network traces, Custom logs in various formats, Process monitor, Performance monitor, ETW traces, Memory dumps, Active directory objects, Registry and what not.
A big challenge when trying to locate responsive information from this MB’s and GB’s of data is how to effectively search through large volumes without over-collecting useless, irrelevant information that can waste precious time and cause delay in resolving the issue.
We use many tools to query this data to make some sense out of it. In this short series of blogs, we will discuss about a simple but a powerful tool called LogParserto troubleshoot variety of issues like slow performance, DOS etc. You can download the tool free from here. It allows you to parse logs of many different formats (IIS, HTTPErr, Event Logs, Active directory, Binary log files, CSV, Event tracing for windows, Event logs, File structure, XML, Registry, Network traces…) using a programming language similar to SQL.
It is a command line tool by the way, but don’t be taken aback by the fact that it is a command line tool and it may need a learning curve. If you are little comfortable with SQL queries, you can master this tool in a couple of hours.
In this blog, we will discuss about identifying Denial of Service attacks from IIS Logs with the help of Log parser.
We have lot of tools and techniques available to identify DOS attacks. But, the classical way is to look at various log files and that’s where LogParser will help us a lot.
Most of the times, when we face performance issues in our server, we may suspect a DOS attack. An easy way to confirm whether our web application is facing a DOS attack or not is to look into IIS logs. Because, IIS records all the requests being served by the web server in the IIS logs.
Let us start with a simple query,
For a normal production server, we will see lot of log files in IIS logfiles folder. One classic way people follow as a preliminary step is to check for patterns in the sizes of those log files. If they see a sudden spike in size, they will pay attention to those log files to check if they have recorded any malicious attempts. Instead of scrolling through that large list of LogFiles in windows explorer, we can leverage LogParser to query the sizes of those files. As I mentioned earlier in this article, we can use LogParser to query Windows File System as well.
The below query will list the size of log files along with Date and time created.
Log File Sizes
LogParser -i:FS "Select Name,Size,CreationTime FROM {Log File Folder} \*.* ORDER BY Size DESC" -o:DataGrid |
The output will be similar to the table below:
Name |
Size |
Creation Time |
u_ex151231.log |
12385 |
2015-12-31 05:38:51 |
u_ex160111.log |
4454 |
2016-01-12 03:26:55 |
u_ex160112.log |
2486 |
2016-01-12 06:59:22 |
u_ex151229.log |
1904 |
2015-12-30 00:51:01 |
u_ex160104.log |
1046 |
2016-01-05 00:18:31 |
u_ex160307_x.log |
656 |
2016-03-07 05:59:05 |
u_ex160310_x.log |
477 |
2016-03-10 05:30:42 |
Having identified the set of log files either with reference to the time of the issue or based on the size of the file, the very first thing what we should confirm is whether we have unusual traffic to our application or not. The below command will list the number of requests made to each page in our application.
Requests Per Page
LogParser -i:IISW3C "SELECT cs-uri-stem, Count(*) AS Hits FROM {Log File Path} GROUP BY cs-uri-stem ORDER BY Hits DESC" -o:Datagrid |
cs -uri-stem |
Hits |
/Auth/login.aspx |
10018 |
/Web.js |
5366 |
/test.aspx |
5205 |
/home.aspx |
4671 |
/contact.aspx |
4589 |
If we see unusual number of requests (the best way to find is by comparing the results against a normal set of data), we need to look further to find out the source of those requests.
If our application is not hosted in a load balanced environment, we can make use of the c-ip field in IIS logs. The below command will list the number of requests made by each client ip to our application.
Number of Requests Per Client IP
LogParser "SELECT c-ip, count(*) as Hits FROM {Log File Path} GROUP BY c-ip ORDER BY Hits DESC" -o:DataGrid |
c-ip |
Hits |
10.1.1.1 |
1521 |
10.1.1.2 |
840 |
10.1.1.8 |
838 |
10.1.1.5 |
697 |
10.1.1.9 |
659 |
10.1.1.4 |
632 |
10.1.1.6 |
595 |
10.1.1.10 |
502 |
10.1.1.3 |
498 |
10.1.1.7 |
478 |
If our application is behind a load balancer, the c-ip field will not be of much use as it records the load balancer IP. In such cases, we should proactively make sure, the IIS log files record the actual client IP.
We can achieve it by configuring the load balancer to forward the client IP address to the IIS by setting the X-Forwarded-For header and configuring IIS to log the X-Forwarded-For. We can either use the custom fields section in IIS as shown below or use the advanced logging module to log the X-Forwarded-For
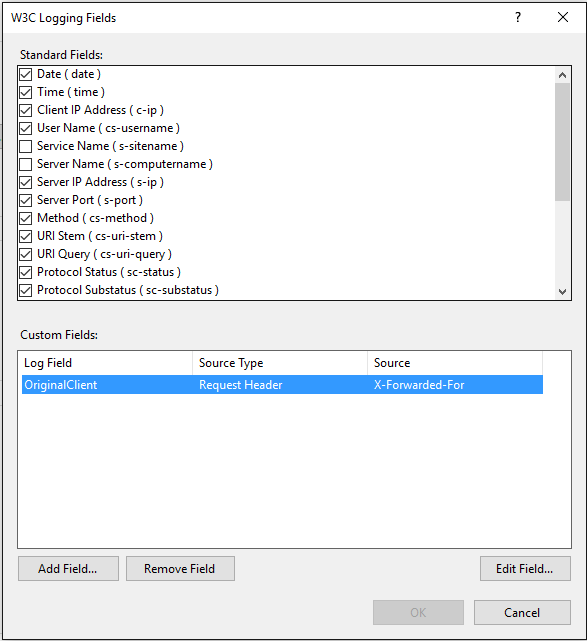
We can modify the above query to get the original client IP’s instead of load balancer IP address. Please modify the {Log Field Name} by the alias name you gave to X-Forwarded-For. In this example the Log Field Name would be OriginalClient.
LogParser "SELECT {Log Field Name} , count(*) as Hits FROM {Log File Path} GROUP BY c-ip ORDER BY Hits DESC" -o:DataGrid |
If we find unusual number of requests from a client IP, we should verify whether the client is a normal client or a source of attack. We can possibly do a reverse DNS check to verify the identity of client machine. If found malicious we can then block all the requests from those IP addresses.
There are many tools available for the reverse DNS lookup. To begin with we can simply use ping or nslookup commands as below:
ping -a {IP} nslookup {IP} |
Log Parser itself has a function to do reverse DNS lookup. The below query will list the c-ip and corresponding client names along with the number of requests from those clients.
Reverse DNS Lookup
LogParser "SELECT c-ip,REVERSEDNS(c-ip), count(*) AS Hits FROM {Log File Path} GROUP BY c-ip ORDER By Count(*) DESC" o:DataGrid |
I have masked the names with (*) in the below output:
c-ip |
REVERSEDNS(c-ip) |
Hits |
10.1.1.1 |
************ |
1521 |
10.1.1.2 |
************ |
840 |
10.1.1.8 |
************ |
838 |
10.1.1.5 |
************ |
697 |
10.1.1.9 |
************ |
659 |
10.1.1.4 |
************ |
632 |
10.1.1.6 |
************ |
595 |
10.1.1.10 |
************ |
502 |
10.1.1.3 |
************ |
498 |
10.1.1.7 |
************ |
478 |
Also, comparing the distribution of HTTP Methods, HTTP Response codes and User agent strings from the log files created during the issue with the normal set of log files will help us to get some insights on the issue. The below commands will list the distribution of Methods, status codes and User agent.
Requests per cs-method
LogParser "SELECT cs-method, count(*) AS Hits FROM {Log File Path} GROUP BY cs-method ORDER By Count(*) DESC" -o:DataGrid |
cs -method |
Hits |
GET |
186288 |
POST |
12791 |
HEAD |
75 |
PROPFIND |
24 |
OPTIONS |
1 |
Http status count
LogParser "SELECT sc-status, count(*) AS Hits FROM {Log File Path} GROUP BY sc-status ORDER By Count(*) DESC" o:DataGrid |
sc -status |
Hits |
304 |
138358 |
200 |
57401 |
302 |
3355 |
503 |
26 |
405 |
24 |
206 |
14 |
404 |
1 |
User agent count
LogParser "SELECT cs(User-Agent), count(*) AS Hits FROM {Log File Path} GROUP BY cs(User-Agent) ORDER By Count(*) DESC" -o:DataGrid |
Cs(User-Agent) |
Hits |
Mozilla/5.0+(Windows+NT+6.1;+WOW64;+Trident/7.0;+rv:11.0)+like+Gecko |
15002 |
Mozilla/5.0+(Windows+NT+6.1;+WOW64)+AppleWebKit/537.36+(KHTML,+like+Gecko)+Chrome/46.0.2490.80+Safari/537.36 |
11982 |
Mozilla/5.0+(Windows+NT+10.0;+WOW64)+AppleWebKit/537.36+(KHTML,+like+Gecko)+Chrome/46.0.2490.80+Safari/537.36 |
7779 |
Mozilla/5.0+(Windows+NT+10.0;+Win64;+x64)+AppleWebKit/537.36+(KHTML,+like+Gecko+Chrome+Safari/537.36+Edge/12.10240 |
7503 |
Mozilla/5.0+(X11;+Linux+x86_64)+AppleWebKit/537.36+(KHTML,+like+Gecko)+Chrome/43.0.2357.125+Safari/537.36 |
7120 |
With the help of above queries we can easily identify whether our application had undergone a DOS attack or not from the IIS logs.
But, we cannot simply come to a conclusion with just looking at the IIS logs. There are other places which we should consider looking before we declare there is nothing suspicious. In my next blog article, we will discuss in detail about identifying DOS attacks from HTTP error logs and network traces.
Thanks for reading and please leave a comment if you have any thoughts on the content of this blog.