A Lap Around SharePoint 2010 Sandboxed Solutions Resource Quotas
In this post, I'll demonstrate sandbox solutions resource quotas and show you what happens when they are exceeded. When sandboxed code executes, certain metrics are collected such as % processor time and # of unhandled exceptions. Timer jobs compile the metrics and calculate resource points usage. When the total resource points used exceeds the daily limit (300 points by default), the sandbox is turned off for the entire site collection. The following table describes the metrics collected and how they are normalized to resource points:
| Resource | Description | Units | Resources per Point | Limit |
| AbnormalProcessTerminationCount | Abnormally terminated process | count | 1 | 1 |
| CPUExecutionTime | CPU Execution Time for site | seconds | 3,600 | 60 |
| CriticalExceptionCount | Critical Exception Events | Events | 10 | 3 |
| InvocationCount | Solution Invocation Events | Events | <TBD> | <TBD> |
| PercentProcessorTime | % CPU usage by solution | % | 85 | 100 |
| ProcessCPUCycles | Solution CPU cycles | cycles | 1 x10^11 | 1 x10^11 |
| ProcessHandleCount | Windows handles count | items | 10,000 | 1,000 |
| ProcessIOBytes | Windows handles count | items | 0 | 1 x10^8 |
| ProcessThreadCount | Thread count in overall process | Thread instances | 10,000 | 200 |
| ProcessVirtualBytes | Memory consumed | Bytes | 0 | 1.0x10^9 |
| SharePointDatabaseQueryCount | Number of SharePoint database queries | Query instances | 20 | 100 |
| SharePointDatabaseQueryTime | Elapsed time to execute query | seconds | 120 | 60 |
| UnhandledExceptionCount | Number of unhandled exceptions | Unhandled exception instances | 50 | 3 |
| UnresponsiveProcessCount | Number of unresponsive processes | Unresponsive process instances | 2 | 1 |
For example, if you developed a sandboxed web part that displayed data from a list, it would perform a SharePoint database query each time it loads. 20 database queries = 1 resource point, so if the web part was displayed 20 times, the site collection would have used 1 resource point. The default site collection maximum is 300 points, so the web part could be displayed 6,000 times in a 24 hour period; after that, the sandbox is turned off until a timer job resets it. It's important to understand is that resource quotas can be exceeded through high usage and is not necessarily an indicator of poorly written code. Quotas may need to be adjusted based on usage patterns, and the 300 point default is not a one-size fits all setting. Another important point is that resource usage is calculated by timer jobs, so it is possible for the quota to be exceeded until the timer jobs run. Sandboxed code will not be terminated mid-execution.
Create Resource Quota Template
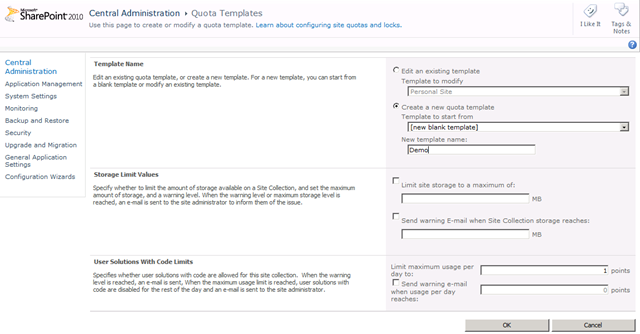
To demonstrate resource quotas, we'll create a resource quota template that only allows 1 resource point per day and create a sandbox web part that throws exceptions. First, we must create a template. Go to Central Administration > Application Management > Specify Quota Templates. Select Create a new quota template and provide a name. Set the maximum usage per day to 1 point:
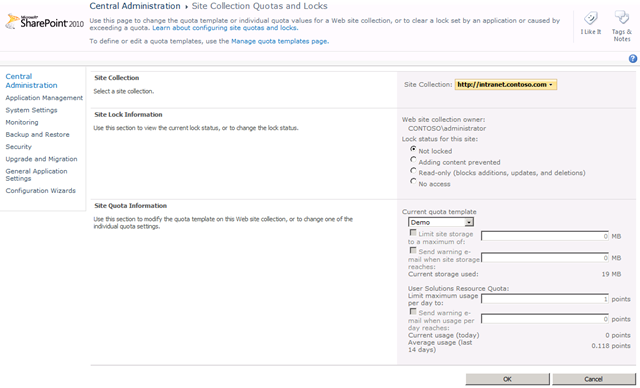
Next, the template must be associated to a site collection. Navigate to Application Management > Configure Quotas and Locks and select the site collection and the quota template:
Create Sandboxed Web Part
Create a sandbox solution with a web part that throws an unhandled exception, for example:
Code Snippet
- protected override void CreateChildControls()
- {
- var button = new Button();
- button.Text = "Exception";
- button.Click += new EventHandler(button_Click);
- this.Controls.Add(button);
- base.CreateChildControls();
- }
- void button_Click(object sender, EventArgs e)
- {
- throw new NotImplementedException();
- }
Add the web part to a page. Now we know that 3 unhandled exceptions is the limit, so click the exception button 3 times.
Since we configured the site collection to use a maximum of 1 resource point per day, you might expect that when you clicked the button a 4th time the execution would be blocked, but usage is calculated by timer jobs. If you open the solution gallery, you'll see that no resource points have been used:
Execute Resource Usage Timer Jobs
Next, we'll manually run the timer jobs to calculate resource usage. Navigate to Monitoring > Review Job Definitions, and you'll find 3 timer jobs for each web application:
| Name | Frequency | Description |
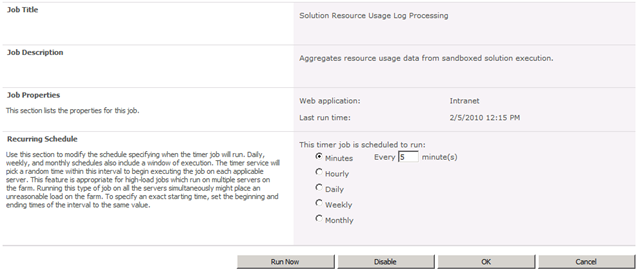
| Solution Resource Usage Log Processing | 5 minutes | Aggregates resource usage data from sandboxed solution execution |
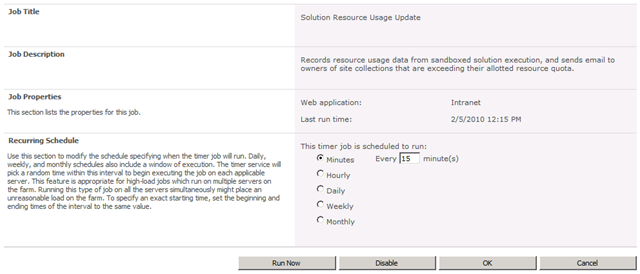
| Solution Resource Usage Update | 15 minutes | Records resource usage data from sandboxed solution execution, and sends email to owners of the site collection that are exceeding their allocated resource quota. |
| Solution Daily Resource Usage Update | Daily | Marks the daily boundary for sandboxed solution resource quota monitoring. |
First, run the usage log processing job for the site collection by clicking "Run Now":
Next, run the usage update job for the site collection:
Return to the solution gallery and you'll notice the daily usage has been updated. The site collection sandbox has also been turned off since we used 1 resource point.
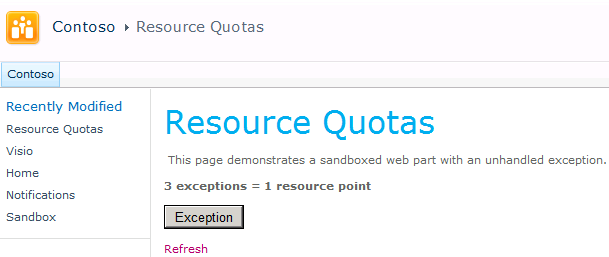
When the sandbox has been turned off, you'll see the following message when you access the page containing the sandboxed web part:
To reset, run the Solution Daily Resource Usage Update timer job:
Summary
In this post, I demonstrated sandboxed solution resource quotas and what happens when the quota is exceeded. The main purpose of resource quotas is to limit the risk that custom code will negatively impact the server farm. Since custom code is the leading cause of support calls, sandboxed solutions and resource quotas provide a measure of confidence not afforded by SharePoint 2007.



![clip_image010[4] clip_image010[4]](https://msdntnarchive.blob.core.windows.net/media/TNBlogsFS/BlogFileStorage/blogs_msdn/johnwpowell/WindowsLiveWriter/ALapAroundSharePoint2010SandboxSolutions_CF9D/clip_image010%5B4%5D_thumb.jpg)