Note
Access to this page requires authorization. You can try signing in or changing directories.
Access to this page requires authorization. You can try changing directories.

Read below if you want a specific MP for load testing
I don't know about you, but I've come across the situation where you need to compare performance.
This MP should help validate performance, whether to validate physical versus virtual, or a new Server Farm, storage performance between environments, etc.
Shout to Tyson Paul for his initial MP with 2016, catch his blog here!
Let's start with the MP shell
Check out the upcoming Gallery download for MP's and fragments here
NOTE: GUID's will vary to your environment
To build the MP, you will need to update the following:
Pack ID to include the OS version

Add Reference for OS Monitoring MP (can use Visual Studio (VS) MP alias if VS is available for use in your environment)
Class Type ID with OS version
Discovery ID and Target with OS Version

Overrides ID with OS Version, and Target with OS MP Rule name and reference
Use the OS Monitoring MP to help with the rule names

The far right of the Override lists the Rule that must match to the OS MP

View ID with OS Version

Folder Item Element ID and ID

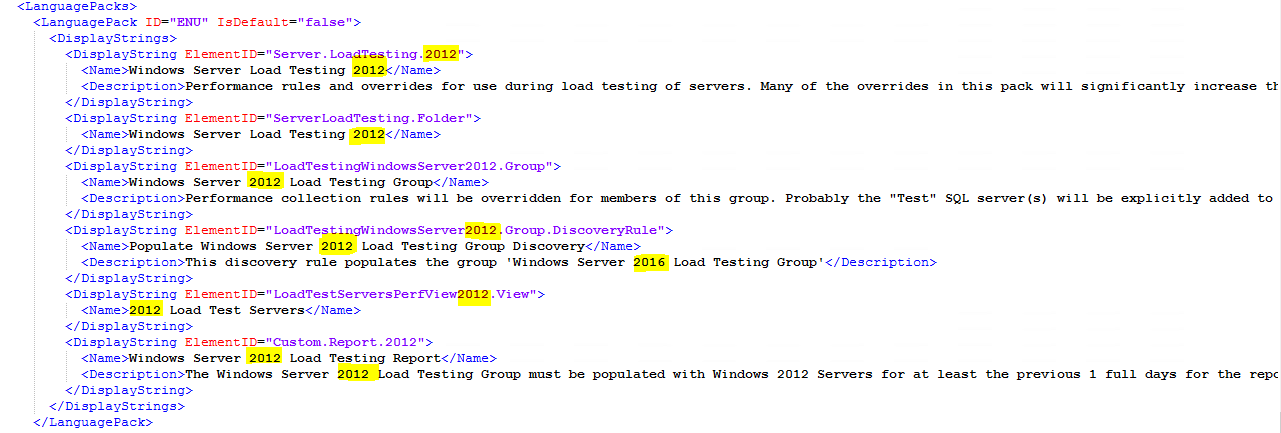
MP Display Strings with OS Version

Save and Import MP without the Report parameter to see what Group ID SCOM assigns the Load Test group
Part 2 - include report after group is imported
Don't forget to update MP version under Identity!

Get Report parameter value for group ID
From PowerShell
get-ScomGroup | ? { $_.DisplayName -like "*Load Testing Group*" } | fl ID,DisplayName
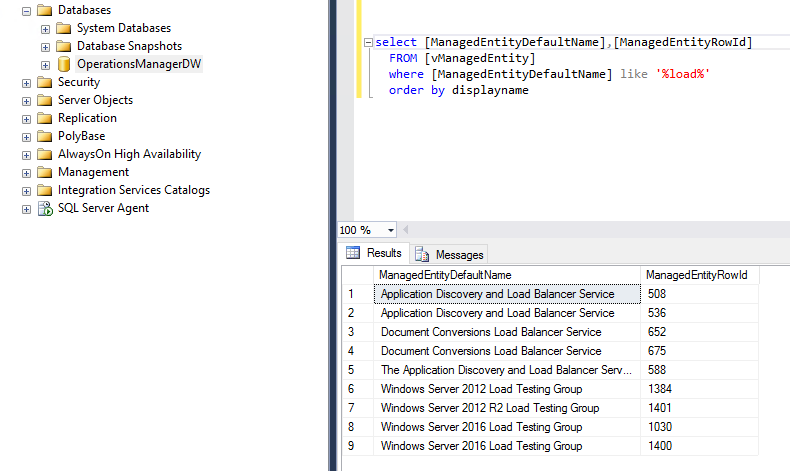
Alternatively, obtain from SQL SSMS
select [ManagedEntityDefaultName],[ManagedEntityRowId]
FROM [vManagedEntity]
where [ManagedEntityDefaultName] like '%load%'
order by displayname
SSMS Output 
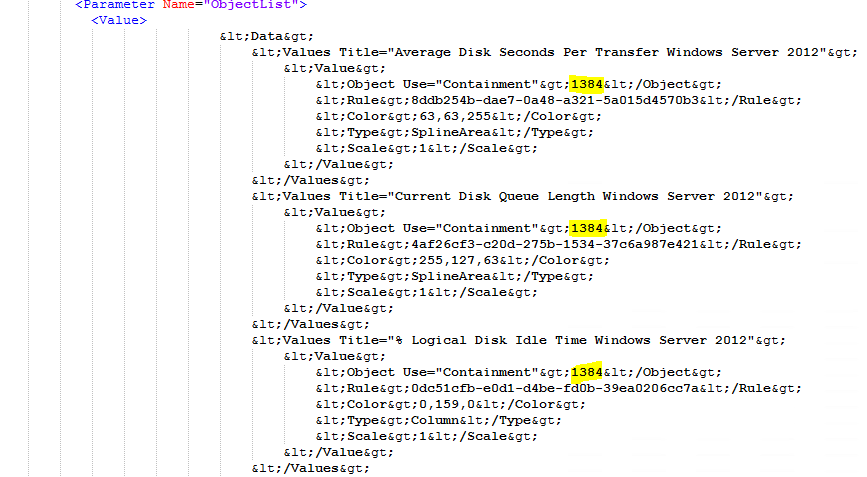
In MP XML, update View Target GUID to your Group ID

Add Report section, and update parameter values Rule GUID

PowerShell commands to run from MS or console installed machine
The GUID's needed for the report parameters section
get-scomrule | ? { $_.DisplayName -like "System Processor Queue Length*" } | fl ID,DisplayName,Name
get-scomrule | ? { $_.DisplayName -like "Current Disk Queue Length*" } | fl ID,DisplayName,Name
get-scomrule | ? { $_.DisplayName -like "Current Disk Queue*" } | fl ID,DisplayName,Name
get-scomrule | ? { $_.DisplayName -like "Current Dis*k Queue*" } | fl ID,DisplayName,Name
get-scomrule | ? { $_.DisplayName -like "*Current Disk Queue*" } | fl ID,DisplayName,Name
get-scomrule | ? { $_.DisplayName -like "*Average Disk Seconds Per Transfer*" } | fl ID,DisplayName,Name
get-scomrule | ? { $_.DisplayName -like "*Logical Disk Idle Time*" } | fl ID,DisplayName,Name
get-scomrule | ? { $_.DisplayName -like "*Processor Time Total*" } | fl ID,DisplayName,Name
get-scomrule | ? { $_.DisplayName -like "*Memory Available Megabytes*" } | fl ID,DisplayName,Name
get-scomrule | ? { $_.DisplayName -like "*Network Adapter Bytes Total*" } | fl ID,DisplayName,Name
get-scomrule | ? { $_.DisplayName -like "*Memory Pages per Second*" } | fl ID,DisplayName,Name
get-scomrule | ? { $_.DisplayName -like "*System Processor Queue Length*" } | fl ID,DisplayName,Name
Verification
- From SCOM Console, Authoring Tab
- Update group with explicit members
- Verify Group members
- From SCOM Console, Monitoring Tab
- Verify Performance view has performance counters
- From SCOM Console Reporting Tab (this may take a few minutes to push report to Reporting server)
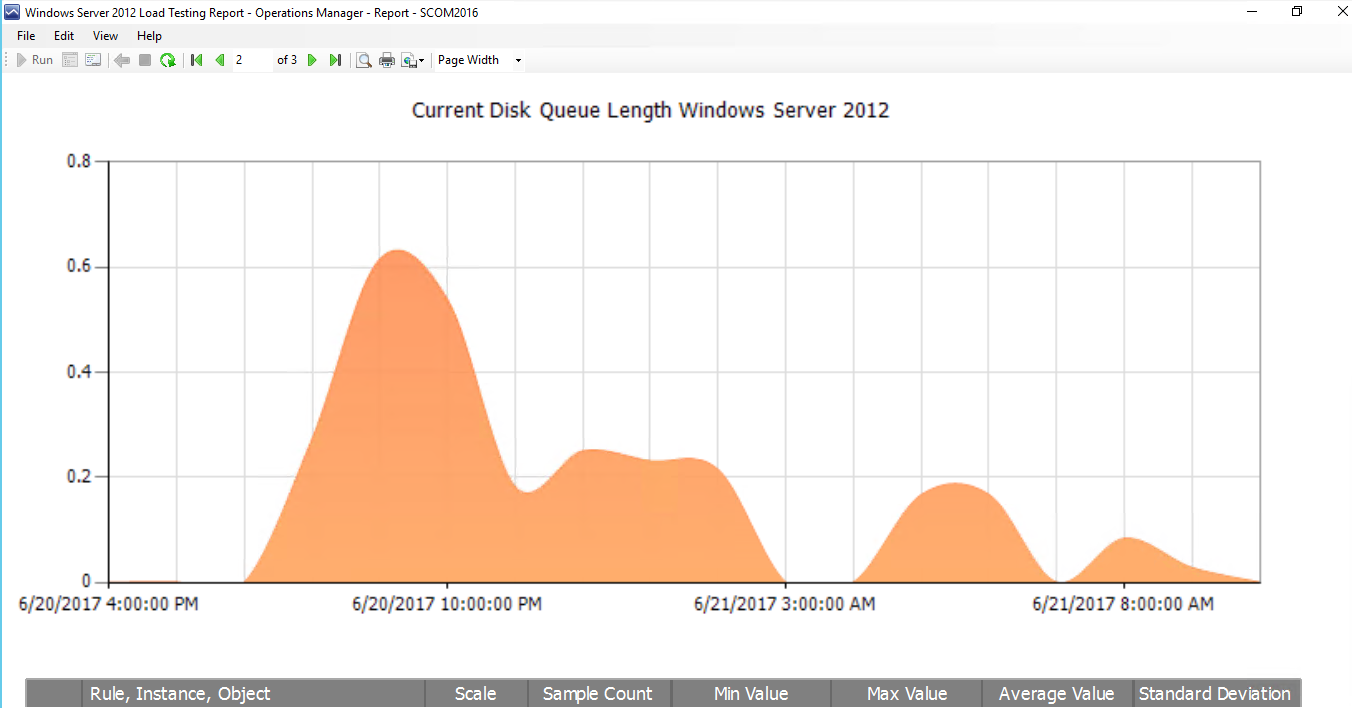
- Open report and run
- Export data for analysis
