Note
Access to this page requires authorization. You can try signing in or changing directories.
Access to this page requires authorization. You can try changing directories.
SignalR is a new library for ASP.NET developers that eases development of real-time web functionality by enabling bi-directional communication between server and client. Azure is a convenient way for customers to host scalable web applications and makes a convenient vehicle for your SignalR applications. Windows Azure Diagnostics can be configured to capture diagnostic information to Azure storage. In this short tutorial, we examine how to leverage Windows Azure Diagnostics to capture performance counters specific to SignalR.
Here are the steps to get a working SignalR web application that utilizes Windows Azure Diagnostics to capture SignalR performance counter data:
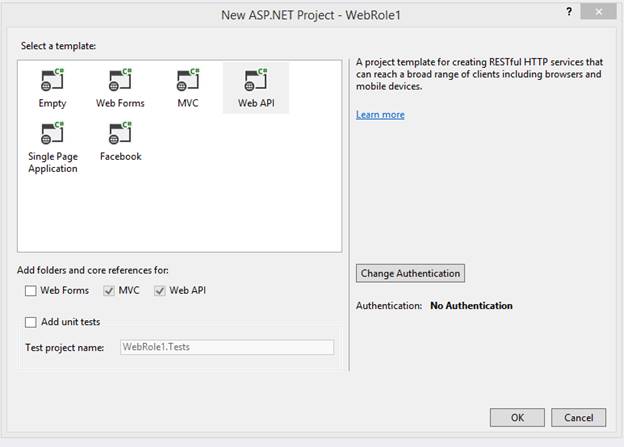
Create a new .NET ASP.NET MVC Web Role Cloud application:


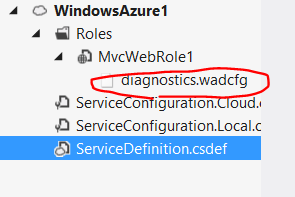
Open up diagnostics.wadcfg in your Azure project and replace its contents with the following configuration information:
<?xml version="1.0"?>
<!-- Specifies the interval at which the diagnostics agent polls the storage service for diagnostics configuration changes-->
<DiagnosticMonitorConfiguration xmlns="https://schemas.microsoft.com/ServiceHosting/2010/10/DiagnosticsConfiguration" configurationChangePollInterval="PT1M" overallQuotaInMB="4096">
<!--Configure the diagnostics infrastructure logs into which the diagnostics agent log data about itself -->
<DiagnosticInfrastructureLogs bufferQuotaInMB="256" scheduledTransferLogLevelFilter="Warning" scheduledTransferPeriod="PT5M" />
<!-- Configure the capture and persistence of basic log from the WAD trace listener-->
<Logs bufferQuotaInMB="100" scheduledTransferLogLevelFilter="Warning" scheduledTransferPeriod="PT5M" />
<!-- Configure the capture and persistence of data located in directories on local file system which are for crash dupmp, failed IIS request logs and IIS logs-->
<Directories bufferQuotaInMB="1024" scheduledTransferPeriod="PT5M">
<CrashDumps container="wad-crash-dumps" directoryQuotaInMB="128" />
<FailedRequestLogs container="wad-frq" directoryQuotaInMB="128"/>
<IISLogs container="wad-iis" directoryQuotaInMB="128" />
<DataSources>
<DirectoryConfiguration container="wad-startup" directoryQuotaInMB="10">
<!-- Absolute specifies an absolute path with optional environment expansion -->
<Absolute expandEnvironment="true" path="%ROLEROOT%\approot\bin\Startup\Log" />
</DirectoryConfiguration>
</DataSources>
</Directories>
<!-- Configure the capture and persistence of performance counters data-->
<PerformanceCounters bufferQuotaInMB="256" scheduledTransferPeriod="PT5M">
<PerformanceCounterConfiguration counterSpecifier="\Processor(_Total)\% Processor Time" sampleRate="PT10S" />
<PerformanceCounterConfiguration counterSpecifier="\LogicalDisk(*)\% Free Space" sampleRate="PT10S" />
<PerformanceCounterConfiguration counterSpecifier="\LogicalDisk(*)\Avg. Disk sec/Transfer" sampleRate="PT10S" />
<PerformanceCounterConfiguration counterSpecifier="\Memory\Available Bytes" sampleRate="PT10S" />
<PerformanceCounterConfiguration counterSpecifier="\ASP.NET\Requests Queued" sampleRate="PT10S" />
<PerformanceCounterConfiguration counterSpecifier="\ASP.NET\Requests Rejected" sampleRate="PT10S" />
<PerformanceCounterConfiguration counterSpecifier="\ASP.NET Applications(__Total__)\Requests/Sec" sampleRate="PT10S" />
<PerformanceCounterConfiguration counterSpecifier="\ASP.NET\Request Wait Time" sampleRate="PT10S" />
<PerformanceCounterConfiguration counterSpecifier="\.NET CLR Memory(w3wp)\% Time in GC" sampleRate="PT10S" />
<PerformanceCounterConfiguration counterSpecifier="\.NET CLR Exceptions(w3wp)\# of Exceps Thrown / sec" sampleRate="PT10S" />
<PerformanceCounterConfiguration counterSpecifier="\.NET CLR LocksAndThreads(w3wp)\# of current logical Threads" sampleRate="PT10S" />
<PerformanceCounterConfiguration counterSpecifier="\.NET CLR LocksAndThreads(w3wp)\# of current physical Threads" sampleRate="PT10S" />
<PerformanceCounterConfiguration counterSpecifier="\.NET CLR LocksAndThreads(w3wp)\Current Queue Length" sampleRate="PT10S" />
<PerformanceCounterConfiguration counterSpecifier="\.NET CLR LocksAndThreads(w3wp)\Contention Rate / sec" sampleRate="PT10S" />
<PerformanceCounterConfiguration counterSpecifier="\.NET CLR Memory(w3wp)\# Bytes in all Heaps" sampleRate="PT10S" />
<PerformanceCounterConfiguration counterSpecifier="\.NET CLR Memory(w3wp)\# GC Handles" sampleRate="PT10S" />
<PerformanceCounterConfiguration counterSpecifier="\.NET CLR Memory(w3wp)\# of Pinned Objects" sampleRate="PT10S" />
<PerformanceCounterConfiguration counterSpecifier="\TCPV4\Segments Retransmitted/sec" sampleRate="PT10S" />
<PerformanceCounterConfiguration counterSpecifier="\TCPV4\Connection Failures" sampleRate="PT10S" />
<PerformanceCounterConfiguration counterSpecifier="\TCPV6\Segments Retransmitted/sec" sampleRate="PT10S" />
<!-- comment out to check that addition occured <PerformanceCounterConfiguration counterSpecifier="\TCPV6\Connection Failures" sampleRate="PT10S" />-->
</PerformanceCounters>
<!-- configure the capture and persistence of the Windows event logs -->
<WindowsEventLog bufferQuotaInMB="100" scheduledTransferLogLevelFilter="Warning" scheduledTransferPeriod="PT5M">
<DataSource name="System!*" />
<DataSource name="Application!*"/>
</WindowsEventLog>
</DiagnosticMonitorConfiguration>
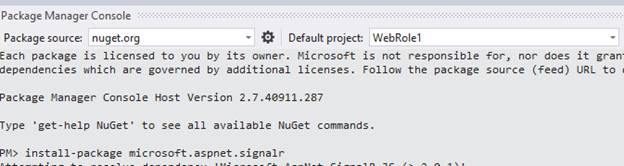
From the Tools\Library Package Manager open up the Package Manager Console. Use it to install SignalR 2.0:
Install signalR utils:

In the web project, create a startup folder and navigate to the packages folder to add the signalr.exe utility:

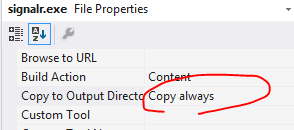
Set the properties of the signalr.exe file to copy always:
Create a new file within the startup directory called SignalrPerfCounterInstall.cmd with the following contents and close the file:
 SET SignalR_LogDir=%~dp0Log\
MKDIR "%SignalR_LogDir%"
cd %~dp0
signalr.exe ipc   >> "%SignalR_LogDir%SignalR_Log.txt" 2>&1
net localgroup "Performance Monitor Users" "Network Service" /ADD >> "%SignalR_LogDir%NetworkAdd.txt" 2>&1
Set the properties of SignalrPerfCounterInstall.cmd to copy always:

Open the file with the built in Binary Editor and remove the extraneous bits if present and save the file:


Navigate to the .csdef file and add the following startup task within your web role:
  <Startup>
      <Task commandLine="startup\SignalrPerfCounterInstall.cmd"
          executionContext="elevated" taskType="background" />
  </Startup>
Remove the jquery bundle from Shared/_Layout.cshtml:

Replace your Home/index.html with the following:
 <script src="~/Scripts/jquery-1.10.2.min.js"></script>
 <script src="~/Scripts/jquery.signalR-2.0.1.min.js"></script>
 <script src="~/signalr/hubs" type="text/javascript"></script>

 <div id="body">
 <section class="featured">
 <div class="content-wrapper">
 <p>
 Hello World!
 </p>
 <div style="font-size:large;">
 My Counter: <span id="counter"></span>
 </div>
 </div>
 </section>
 <section class="content-wrapper main-content clear-fix"></section>
 </div>


 <script type="text/javascript">
 $(document).ready(function () {

 var hub = $.connection.myHub;


 hub.client.sendResult = function (x) {
 console.log('sendResult(' + x + ')');
 $("#counter").text(x);
 window.setTimeout(function () {
 hub.server.increment(x);
 }, 1000);

 };


 $.connection.hub.connected = function () {
 };
 $.connection.hub.disconnected = function () {
 };


 $.connection.hub.stateChanged(function (change) {
 console.log('new State' + change.newState);
 if (change.newState === $.signalR.connectionState.disconnected) {
 $.connection.hub.start();
 }
 if (change.newState === $.signalR.connectionState.reconnecting) {
 console.log('Re-connecting');

 } else if (change.newState === $.signalR.connectionState.connected) {
 console.log('The server is online');
 }
 });

 $.connection.hub.error(function (error) {
 console.log('error ' + error);
 });
 $.connection.hub.logging = true;
 $.connection.hub.reconnected(function () {
 console.log('Reconnected');
 hub.server.increment(0);
 });

 $.connection.hub.start().done(function () {
 console.log('hub started');
 hub.server.increment(0);
 });

 });

 </script>
Now create a Hubs folder and add the MyHub class as follows:
 namespace WebRole1.Hubs
 {
using Microsoft.AspNet.SignalR; `` using System; `` using System.Collections.Generic; `` using System.Linq; `` using System.Threading.Tasks; `` using System.Web; `` public class MyHub : Hub `` {public async Task Increment(int x) `` {await this.Clients.Caller.sendResult(x+1);}}}Crank.exe (a test tool to generate load discussed below) requires a PersistentConnection so add a PersistentConnectionFolder and add the MyPersistentConnection class as follows:
 using System.Threading.Tasks;
using Microsoft.AspNet.SignalR;
using Microsoft.AspNet.SignalR.Infrastructure;

 public class MyPersistentConnection : PersistentConnection
 {
protected override Task OnReceived(IRequest request, string connectionId, string data)
{// Broadcast data to all clients
return Connection.Broadcast(data);}
}SignalR 2.0 requires Owin so add the following Startup.cs object:
 namespace WebRole1
 {
using Microsoft.AspNet.SignalR; `` using Microsoft.Owin; `` using WebRole1.PersistentConnection; `` using Owin; `` public class Startup `` {public void Configuration(IAppBuilder app) `` {// Map all hubs to "/signalr" `` app.MapSignalR(); `` // Map the Echo PersistentConnection to "/echo" `` app.MapSignalR<MyPersistentConnection>("/broad");}}}Diagnostics is started before role startup so we need to dynamically add the performance counters. Furthermore, they are process specific so it is imperative that we dynamically register them from within Global.asax.cs. The following is a bit hokey but works:
First create a SignalRDiagnosticHelper.cs class:
 namespace WebRole1.SignalRHelper
 {

 using System;
 using System.Linq;
 using Microsoft.WindowsAzure.Diagnostics;
 using Microsoft.WindowsAzure.Diagnostics.Management;
 using Microsoft.WindowsAzure.ServiceRuntime;

 public class SignalRDiagnosticHelper
 {
private const string EmulatorCategoryTemplate = "signalr({0}_web)"; `` private const string CloudCategoryTemplate = "signalr({0}_in_{1}_web)"; `` public static string creatSignalRCategoryName() `` {if (RoleEnvironment.IsEmulated) `` { `` string id = RoleEnvironment.CurrentRoleInstance.Id.ToLower(); `` return string.Format(EmulatorCategoryTemplate, id); `` } `` else `` { `` var name = RoleEnvironment.CurrentRoleInstance.Role.Name.ToLower(); `` var number = RoleEnvironment.CurrentRoleInstance.Id.Split(new char[] { '_' }).Last(); `` return string.Format(CloudCategoryTemplate, name, number); `` }}
public static void RegisterSignalRPerfCounters()
{TimeSpan ts = new TimeSpan(0, 0, 10);
RoleInstanceDiagnosticManager roleInstanceDiagnosticManager =
new RoleInstanceDiagnosticManager(
RoleEnvironment.GetConfigurationSettingValue("Microsoft.WindowsAzure.Plugins.Diagnostics.ConnectionString"),
RoleEnvironment.DeploymentId,
RoleEnvironment.CurrentRoleInstance.Role.Name,
RoleEnvironment.CurrentRoleInstance.Id);// Get the current diagnostic monitor for the role.
var config = roleInstanceDiagnosticManager.GetCurrentConfiguration() ?? DiagnosticMonitor.GetDefaultInitialConfiguration();string connectionString = RoleEnvironment.GetConfigurationSettingValue("Microsoft.WindowsAzure.Plugins.Diagnostics.ConnectionString");
string deploymentID = RoleEnvironment.DeploymentId;
string roleName = RoleEnvironment.CurrentRoleInstance.Role.Name;// Get the DeploymentDiagnosticManager object for your deployment.
DeploymentDiagnosticManager diagManager = new DeploymentDiagnosticManager(connectionString, deploymentID);var signalRCategoryName = creatSignalRCategoryName();
RegisterCounter("Connections Connected", ts, signalRCategoryName, config);
RegisterCounter("Connections Reconnected", ts, signalRCategoryName, config);
RegisterCounter("Connections Disconnected", ts, signalRCategoryName, config);
RegisterCounter("Connections Current", ts, signalRCategoryName, config);
RegisterCounter("Connection Messages Received Total", ts, signalRCategoryName, config);
RegisterCounter("Connection Messages Sent Total", ts, signalRCategoryName, config);
RegisterCounter("Connection Messages Received/Sec", ts, signalRCategoryName, config);
RegisterCounter("Connection Messages Sent/Sec", ts, signalRCategoryName, config);
RegisterCounter("Message Bus Messages Received Total", ts, signalRCategoryName, config);
RegisterCounter("Message Bus Messages Received/Sec", ts, signalRCategoryName, config);
RegisterCounter("Scaleout Message Bus Messages Received/Sec", ts, signalRCategoryName, config);
RegisterCounter("Message Bus Messages Published Total", ts, signalRCategoryName, config);
RegisterCounter("Message Bus Messages Published/Sec", ts, signalRCategoryName, config);
RegisterCounter("Message Bus Subscribers Current", ts, signalRCategoryName, config);
RegisterCounter("Message Bus Subscribers Total", ts, signalRCategoryName, config);
RegisterCounter("Message Bus Subscribers/Sec", ts, signalRCategoryName, config);
RegisterCounter("Message Bus Allocated Workers", ts, signalRCategoryName, config);
RegisterCounter("Message Bus Busy Workers", ts, signalRCategoryName, config);
RegisterCounter("Message Bus Topics Current", ts, signalRCategoryName, config);
RegisterCounter("Errors: All Total", ts, signalRCategoryName, config);
RegisterCounter("Errors: All/Sec", ts, signalRCategoryName, config);
RegisterCounter("Errors: Hub Resolution Total", ts, signalRCategoryName, config);
RegisterCounter("Errors: Hub Resolution/Sec", ts, signalRCategoryName, config);
RegisterCounter("Errors: Hub Invocation Total", ts, signalRCategoryName, config);
RegisterCounter("Errors: Hub Invocation/Sec", ts, signalRCategoryName, config);
RegisterCounter("Errors: Tranport Total", ts, signalRCategoryName, config);
RegisterCounter("Errors: Transport/Sec", ts, signalRCategoryName, config);
RegisterCounter("Scaleout Streams Total", ts, signalRCategoryName, config);
RegisterCounter("Scaleout Streams Open", ts, signalRCategoryName, config);
RegisterCounter("Scaleout Streams Buffering", ts, signalRCategoryName, config);
RegisterCounter("Scaleout Errors Total", ts, signalRCategoryName, config);
RegisterCounter("Scaleout Errors/Sec", ts, signalRCategoryName, config);
RegisterCounter("Scaleout Send Queue Length", ts, signalRCategoryName, config);// useful for checking that it is not the category name that is issue...
RegisterCounter("Connection Failures", ts, "TCPV6", config);// Apply the updated configuration to the diagnostic monitor.
DiagnosticMonitor.Start("Microsoft.WindowsAzure.Plugins.Diagnostics.ConnectionString", config);
return;} `` public static void RegisterCounter(string counterType, TimeSpan sampleRate, string category, DiagnosticMonitorConfiguration config) `` {var counterSpecifier = "\\" + category + "\\" + counterType; `` config.PerformanceCounters.DataSources.Add(new PerformanceCounterConfiguration() `` { `` CounterSpecifier = counterSpecifier, `` SampleRate = sampleRate `` });}} }Next we must call this from within Application_Start() within global.asax.cs as follows:
 public class WebApiApplication : System.Web.HttpApplication
 {
protected void Application_Start() `` {SignalRHelper.SignalRDiagnosticHelper.RegisterSignalRPerfCounters(); `` AreaRegistration.RegisterAllAreas(); `` WebApiConfig.Register(GlobalConfiguration.Configuration); `` FilterConfig.RegisterGlobalFilters(GlobalFilters.Filters); `` RouteConfig.RegisterRoutes(RouteTable.Routes); `` BundleConfig.RegisterBundles(BundleTable.Bundles);}}Navigate to the web.config file and configure the Owin startup class within appSettings:
<add key="owin:AppStartup" value="WebRole1.Startup, WebRole1" />
Replace the system.diagnostics element from web.config with the following to copy over event log data as well:
<system.diagnostics>
<trace>
<listeners>
<add type="Microsoft.WindowsAzure.Diagnostics.DiagnosticMonitorTraceListener, Microsoft.WindowsAzure.Diagnostics, Version=2.2.0.0, Culture=neutral, PublicKeyToken=31bf3856ad364e35" name="AzureDiagnostics">
<filter type="" />
</add>
</listeners>
</trace>
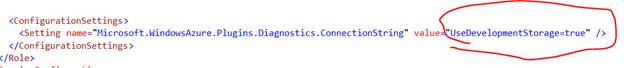
</system.diagnostics>We are almost done! Navigate to the cloud.cscfg file and add an azure storage account to the following setting:
Deploy your application.
Navigate to your deployed application. You should receive a Hello World Message and see a counter increasing:

You can view your Perf Counter data using the excellent utility from Cerebrata called Azure Diagnostics Manager. They do have a trial available prior to purchase. Once you have installed the program and added your storage account you can click on the Performance Counters Tab and see SignalR Perf Counter Data from your Azure Web Roles:

Note if you run into issues you should set up Remote Desktop Access and verify that the startup scripts executed by checking for the logs:

That's it! If you want to easily generate additional load you should download the Crank tool built by the SignalR team.
Comments
- Anonymous
January 23, 2014
Super helpful article for some wanting to get started on Signal R perf counters. Well done sir!