Using ExTRA to find long running transactions inside Store
During your normal flow of troubleshooting performance for Exchange, you may have the need to see what functions might be consuming higher than normal resources on your Exchange server. These functions might be causing spikes in CPU usage or sustained CPU usage over time.
Luckily, the Exchange Troubleshooting Assistant could help you gather the necessary data to understand what is going on inside store without having the need to dump the store process and then calling Support for analysis of this file.
Mind you, this doesn't cover every scenario, but will help to bring out some of the more common issues you may see with latent calls. Here is a short list of what we could report on:
- Slow LSASS calls
- Slow Directory lookups
- Long running Virus Scanner calls
- IMAIL conversion
- Jet Snapshot calls taking a long time
- Slow calls (read/write) to the database
With that said, let's get on to running the tool. It is important to note that this tool should be run during the time of the problem, not after as whatever it was causing the issue, is now gone.
Start ExTRA
To start the tool, you can do this either of two ways.
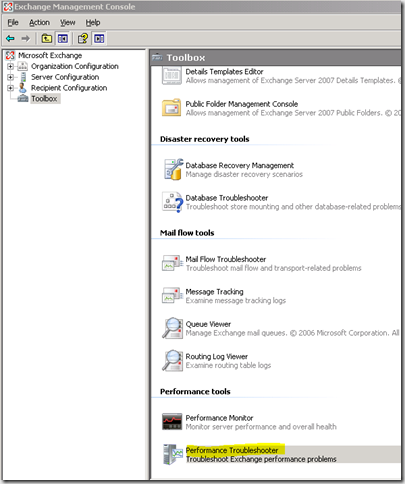
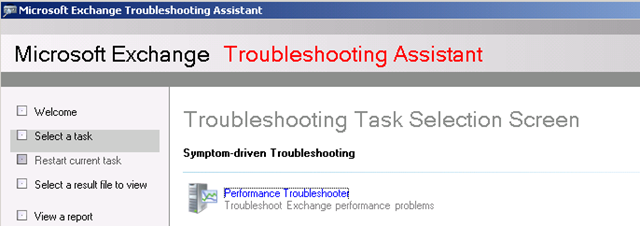
Using the Performance Troubleshooter tool in the Exchange Management Console (EMC) under Toolbox
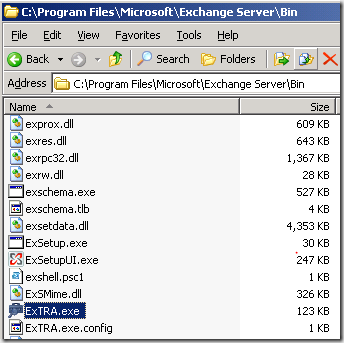
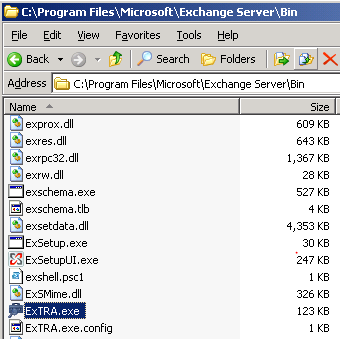
Directly launching ExTRA.Exe from the \program files\Microsoft\Exchange Server\bin directory
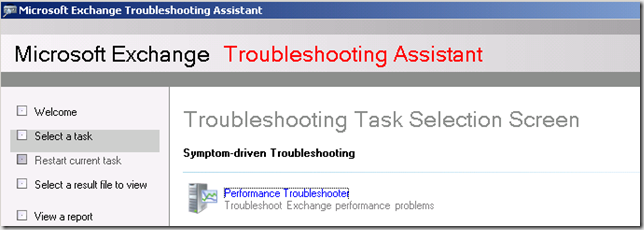
Click on the "Select a Task" option in the menu on the left, Then select the "Performance Troubleshooter" in the list of tasks.
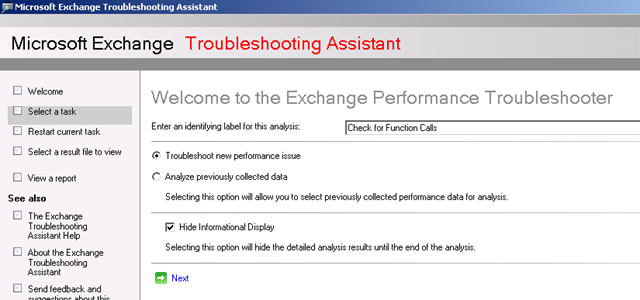
Configuring ExTRA for a new session
Once the Performance Troubleshooter has been selected, Enter an identifying name for this run. Click Next
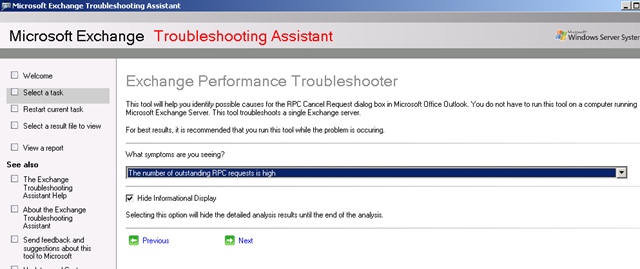
In the drop down list, select "The number of outstanding RPC requests is high". Click Next
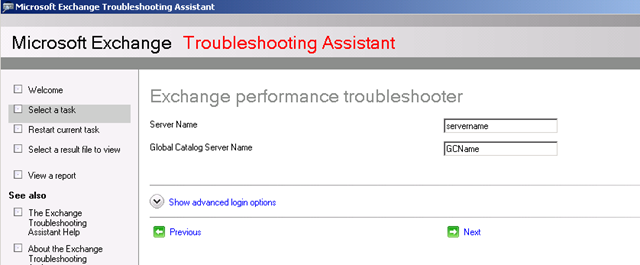
Enter the appropriate Exchange server name and Global Catalog Server name. Note: If you are logging on from an account that does not have permissions to the Exchange server, select the "Show advanced login options" to enter a different set of credentials. Click Next when done.
Select a location to store the Performance logs
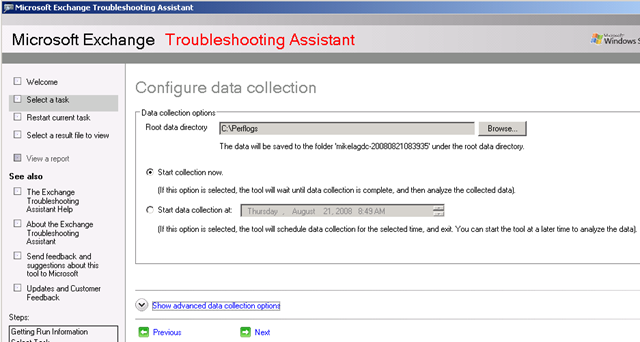
Select "Show advanced data collection options"
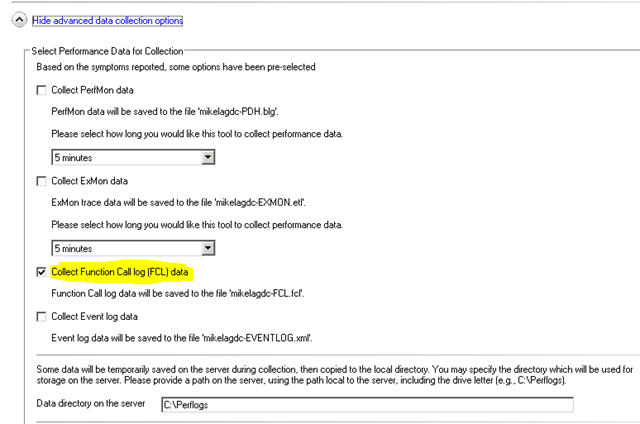
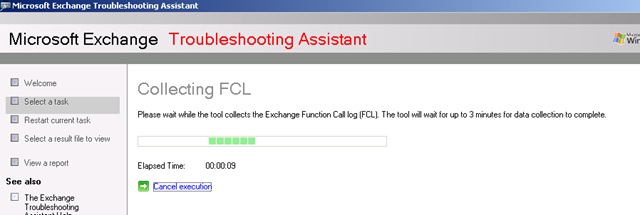
Make sure that "Collect Function log (FCL) data is selected. Click Next
The trace will the start and collect data for 3 minutes and then perform some statistical analysis on the data collected.
You will then be presented with the results of the analysis and then tell you if any function calls are consuming an exorbitant amount of time. If anything if found, it will be reported here. In this case, there was not a problem on the server, but if there was, it would be reported right here.
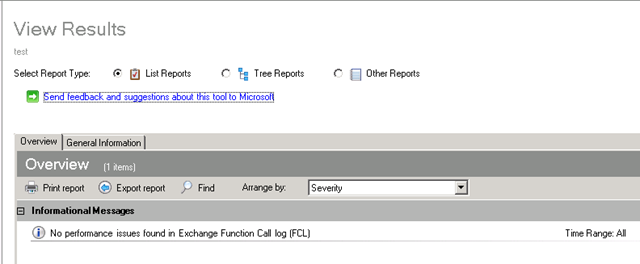
This may give you some immediate clues in less than 5 minutes on what might be occurring inside the store process.
Happy Troubleshooting!!