1 Million predictions/sec with Machine Learning Server web service
Microsoft Machine Learning Server Operationalization allows users to publish their R/Python based models and scripts as "Web-Services" and consume them from a variety of client applications in a scalable, fast, secure and reliable way. In this blog, I want to demonstrate how you can score > 1 Million predictions per second with the 'Realtime' web-services. Realtime web services offer lower latency to produce results faster and score more models in parallel. The improved performance boost comes from the fact that these web services do not depend on an interpreter at consumption time even though the services use the objects created by the model. Therefore, fewer additional resources and less time is spent spinning up a session for each call. Additionally, the model is only loaded once in the compute node and can be scored multiple times.
Step 1: Publish a Realtime web-service:
Users can publish a 'Realtime' web-service from supported models created in R using RevoScaleR and MicrosoftML packages or Python models created using revoscalepy and microsoftml packages.
In our case, we will create a RevoScaleR::rxDTree model in R based on Kyphosis dataset. We will then publish the model as a 'Realtime' web-service using mrsdeploy package, to get fast performance and then try to score against it to ensure we have same prediction results. Python users can use revoscalepy.rx_dtree to create a similar model in Python.
library(RevoScaleR) library(rpart) library(mrsdeploy) form <- Kyphosis ~ Number + Start parms <- list(prior = c(0.8, 0.2), loss = c(0, 2, 3, 0), split = 'gini'); method <- 'class'; parms <- list(prior = c(0.8, 0.2), loss = c(0, 2, 3, 0), split = 'gini'); control <- rpart.control(minsplit = 5, minbucket = 2, cp = 0.01, maxdepth = 10, maxcompete = 4, maxsurrogate = 5, usesurrogate = 2, surrogatestyle = 0, xval = 0); cost <- 1 + seq(length(attr(terms(form), 'term.labels'))); myModel <- rxDTree(formula = form, data = kyphosis, pweights = 'Age', method = method, parms = parms, control = control, cost = cost, maxNumBins = 100, maxRowsInMemory = if(exists('.maxRowsInMemory')) .maxRowsInMemory else -1) myData <- data.frame(Number=c(70), Start=c(3)); op1 <- rxPredict(myModel, data = myData); op1 <- rxPredict(myModel, data = myData) print(op1) # absent_Pred present_Pred # 1 0.925389 0.07461104 # Let's publish the model as a 'Realtime' web-service remoteLogin("https:// [Your-Server-IP]:[Port] ", username=" [username] ", password=" [Password] ", session=FALSE) name <- 'rtService'<br>ver <- '1.0' svc <- publishService(name, v=ver, code=NULL, serviceType='Realtime', model=myModel) op2 <- svc$consume(myData) print(op2$outputParameters$outputData) # $absent_Pred # $absent_Pred[[1]] # [1] 0.925389 # $present_Pred # $present_Pred[[1]] # [1] 0.07461104
Step 2: Create Load-Test plan:
For our load-testing, we will use Apache JMeter application which is open source software, a 100% pure Java application designed to load test functional behavior and measure performance. Follow the steps below to create a JMeter test plan that works with ML Server web-service. As always, you can find the test-plan JMX file here on github: MLServer JMeter Test Plan
For load testing we will create 1000 number of threads (users) with each thread sending input dataframe with 1000 rows ('nrows' below) for scoring.
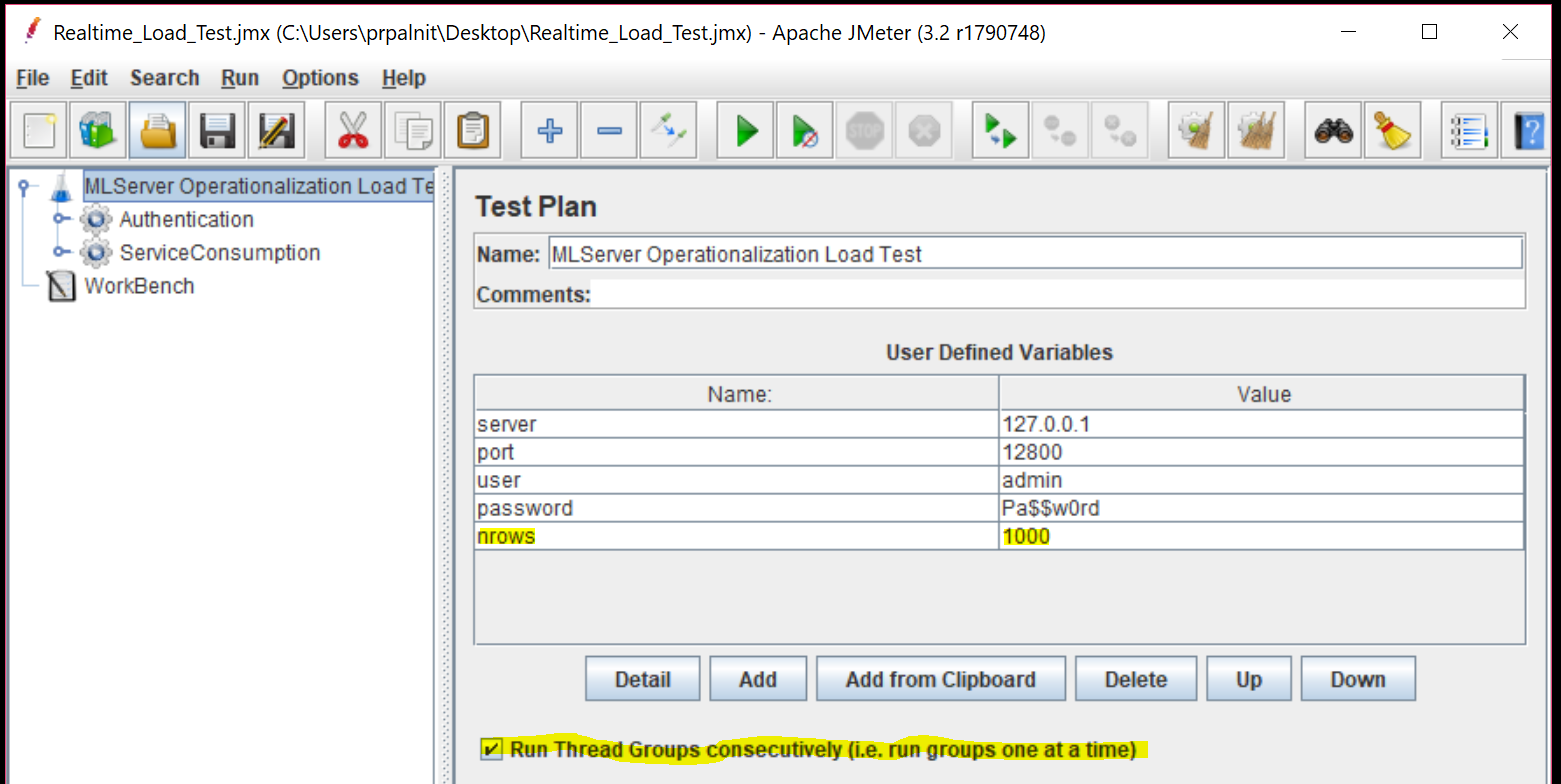
We will create 2 thread groups "Authentication" and "ServiceConsumption" as shown in screenshot. The first thread-group will authenticate with the server, and will set the token property. This token will then be used by the second thread group for consuming our web-service with 1000 threads. Without the token, we will not be able to consume the service. For this reason, make sure to click the "Run Thread Groups consecutively" checkbox.
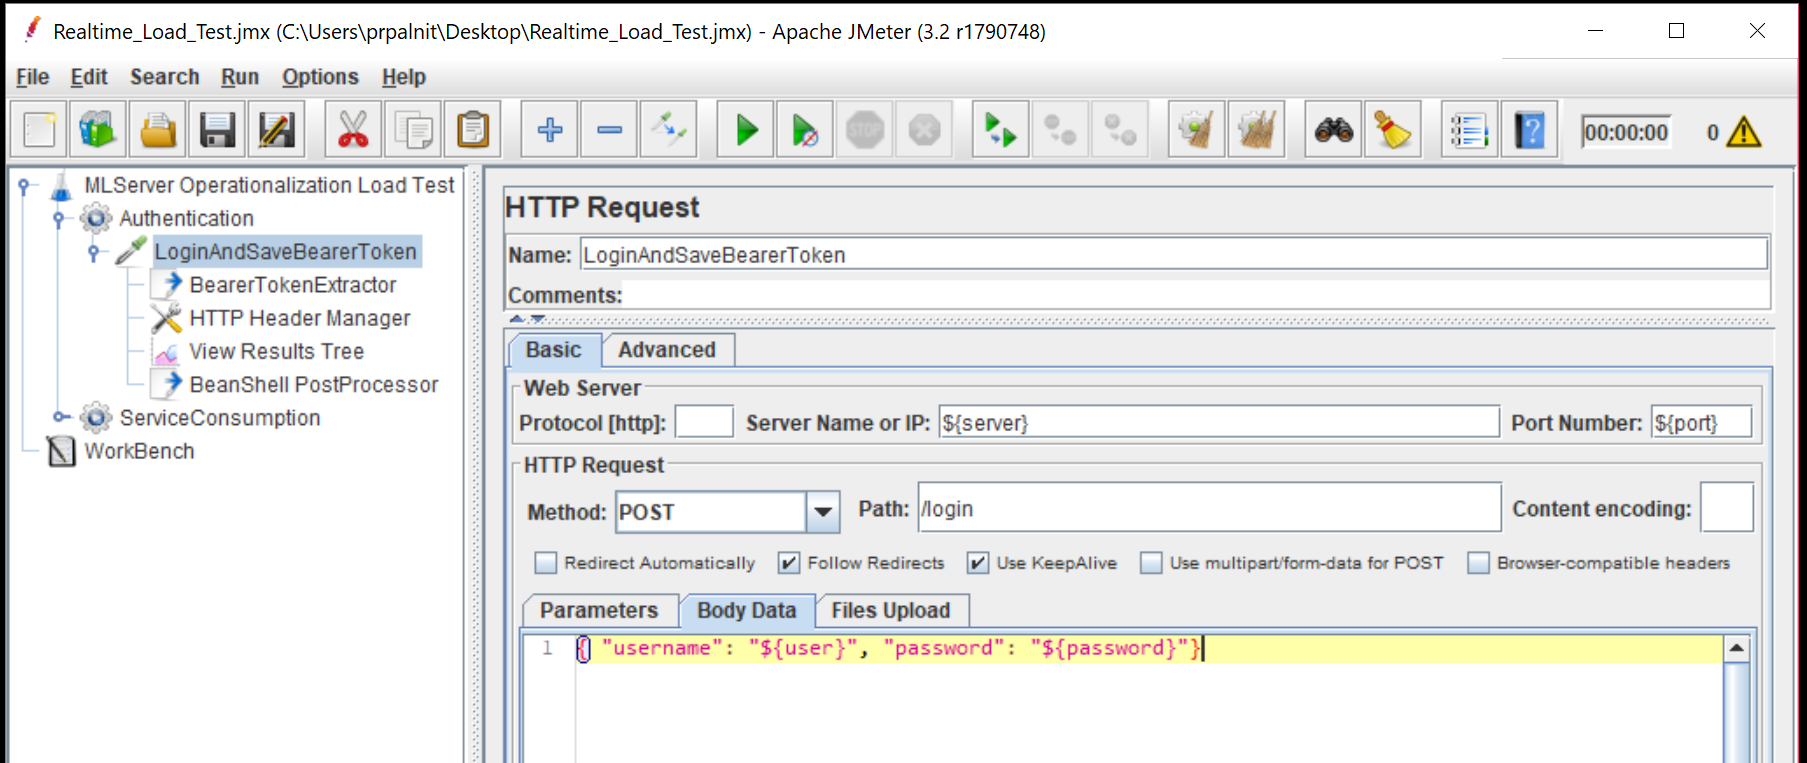
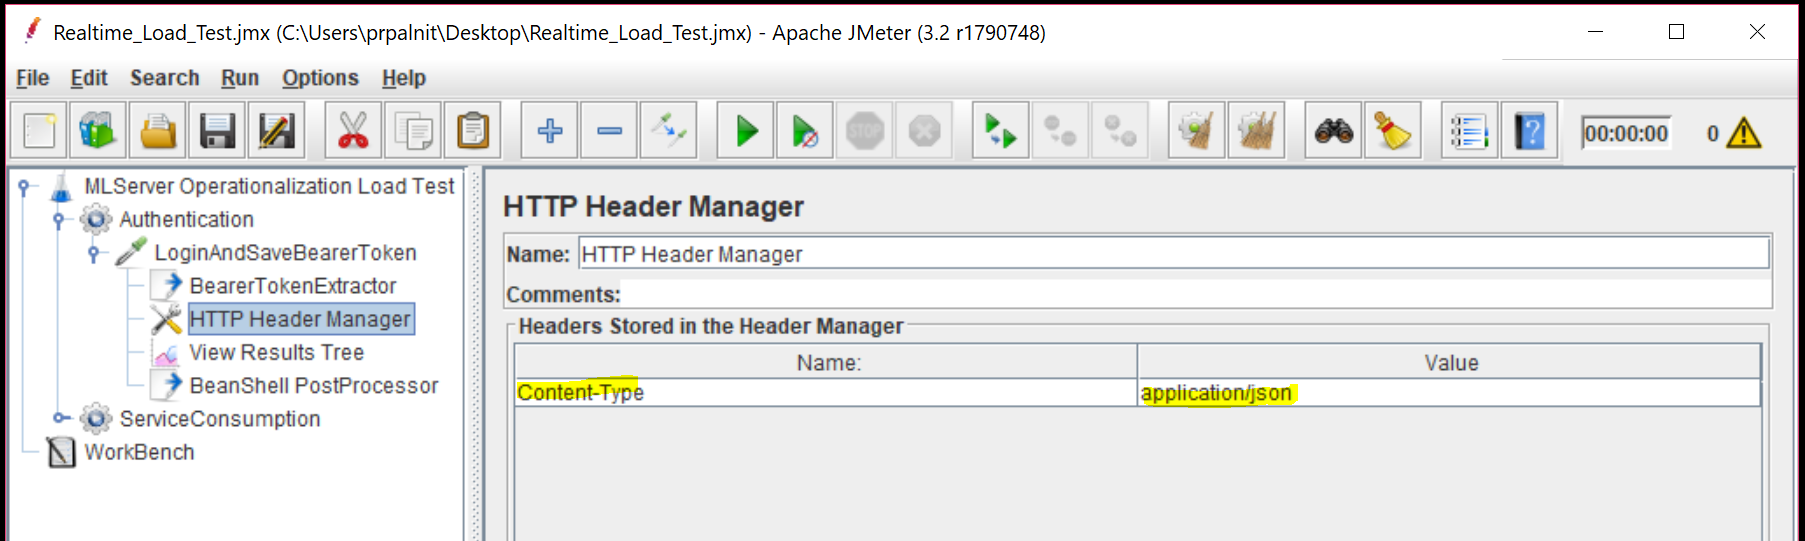
Create HTTP Request sampler and add the body data as shown. For headers, you just need Content-Type field.
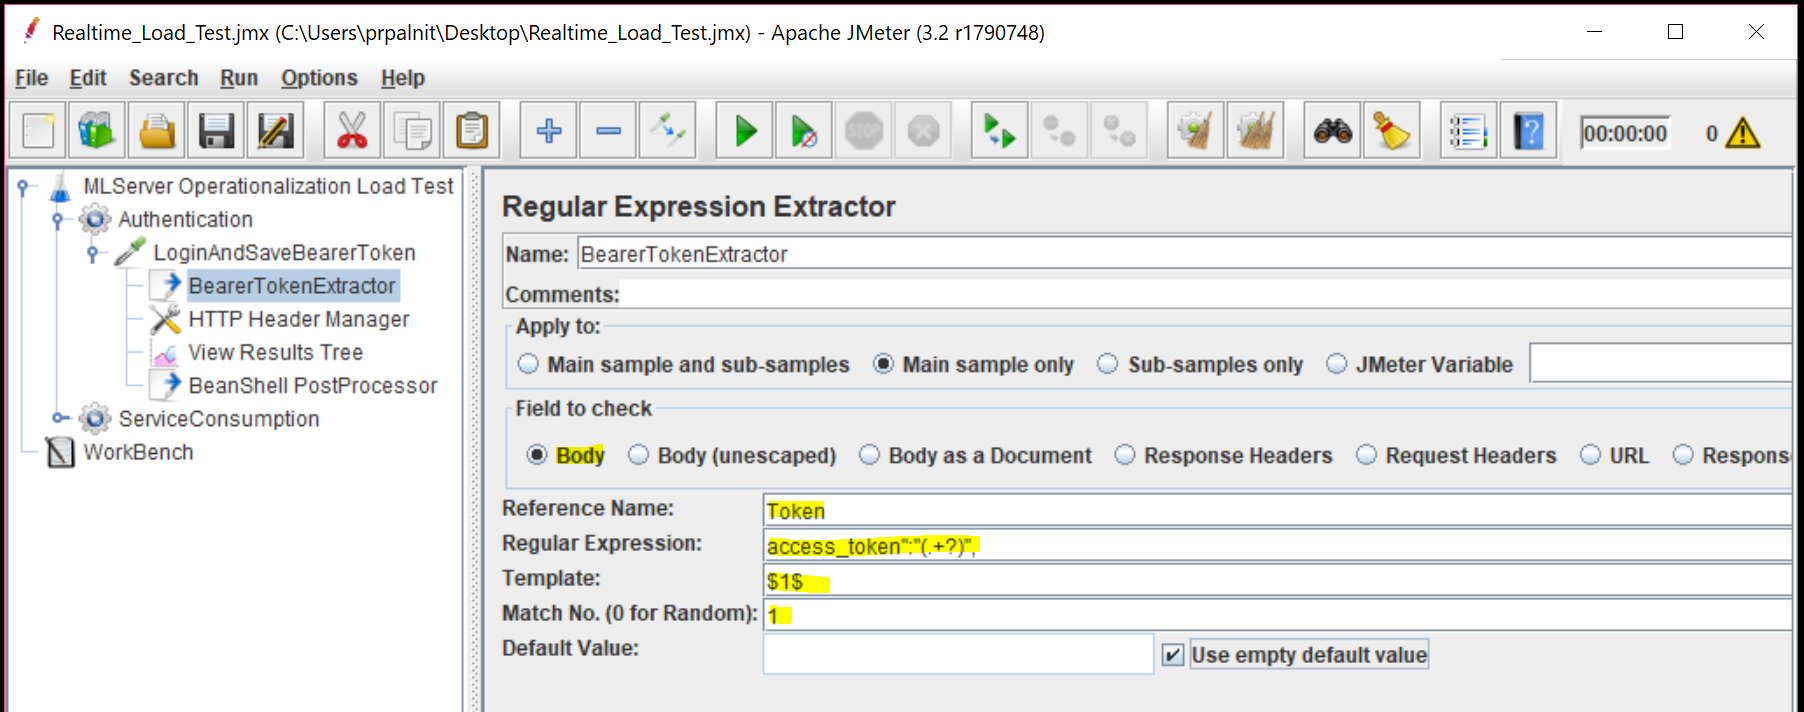
Under the HTTP Request, we add a 'regular expression extractor'. In this, we will parse the response from the server and extract the Bearer token returned.
In order for subsequent HTTP requests to use the bearer token, let's add a "Bean Shell post-processor", which will set token property. Additionally, here we will also create the "Body" JSON request with 'nrows' number of rows for each column. For example, if nrows = 5, then our JSON body will look like this:
"Number": [70,70,70,70,70], "Start":[3,3,3,3,3]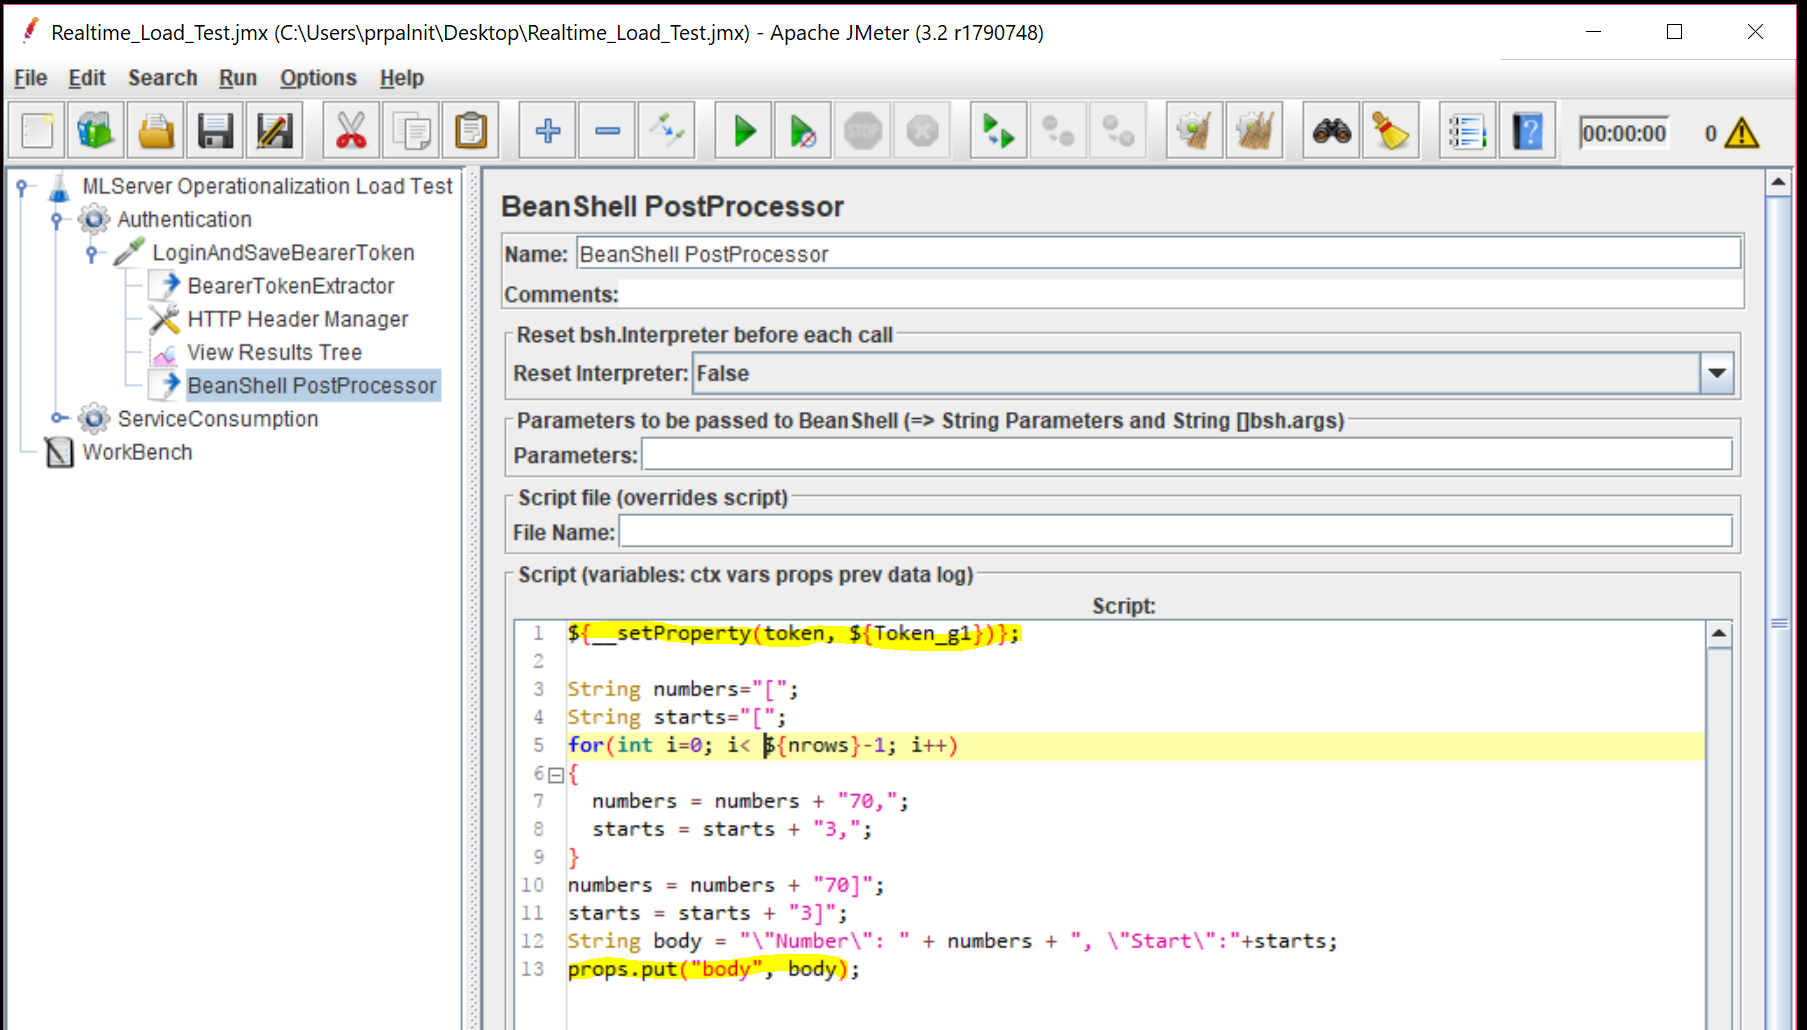
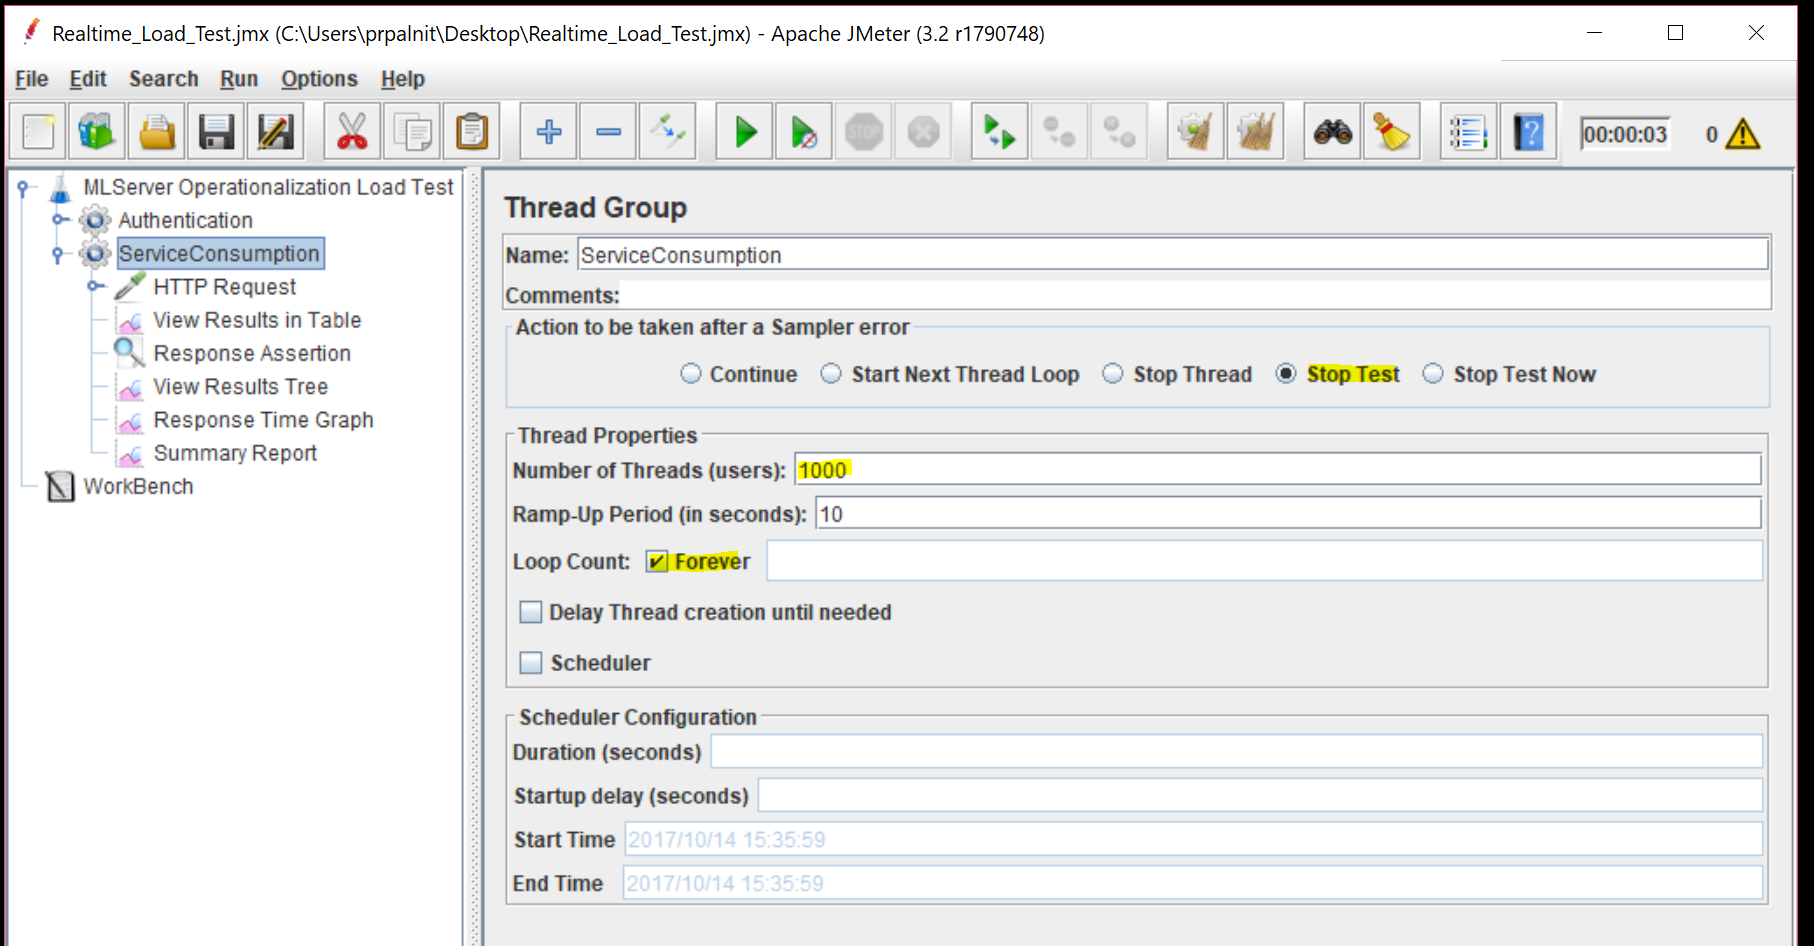
Let's look at the second Thread group "ServiceConsumption" now. Let's add "HTTP Request" sampler under this thread group. Ensure the below parameter values, that will make sure we have 1000 threads that will keep running forever. We will also stop the test as soon as we encounter any HTTP errors with our requests.
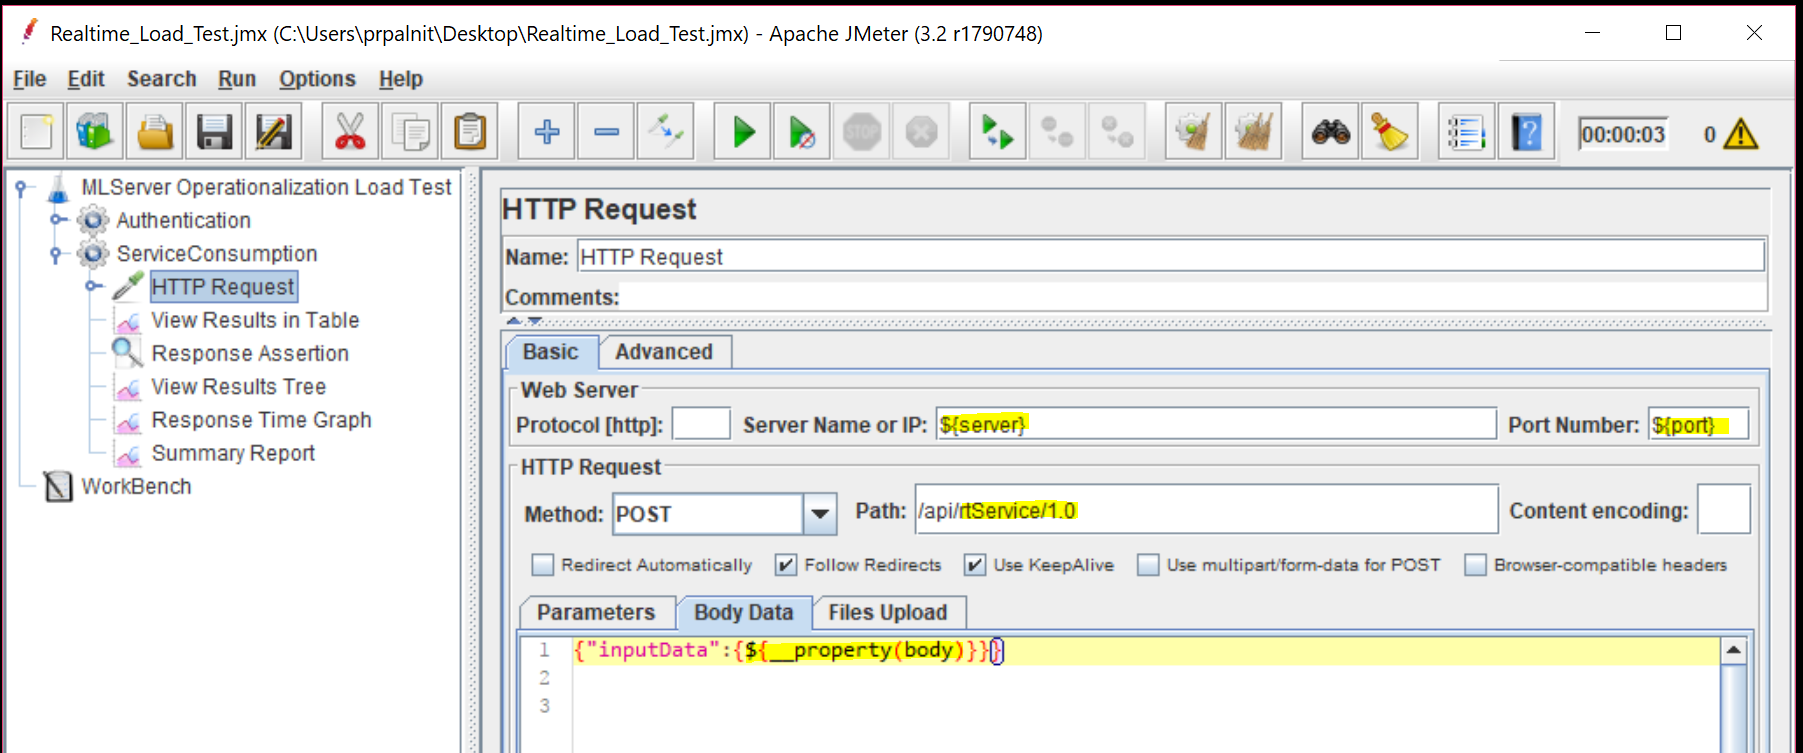
Here is how our Body for the requests will look like. Notice, we are using "body" property that we created in first thread group. Ensure you have correct server, port and path values.
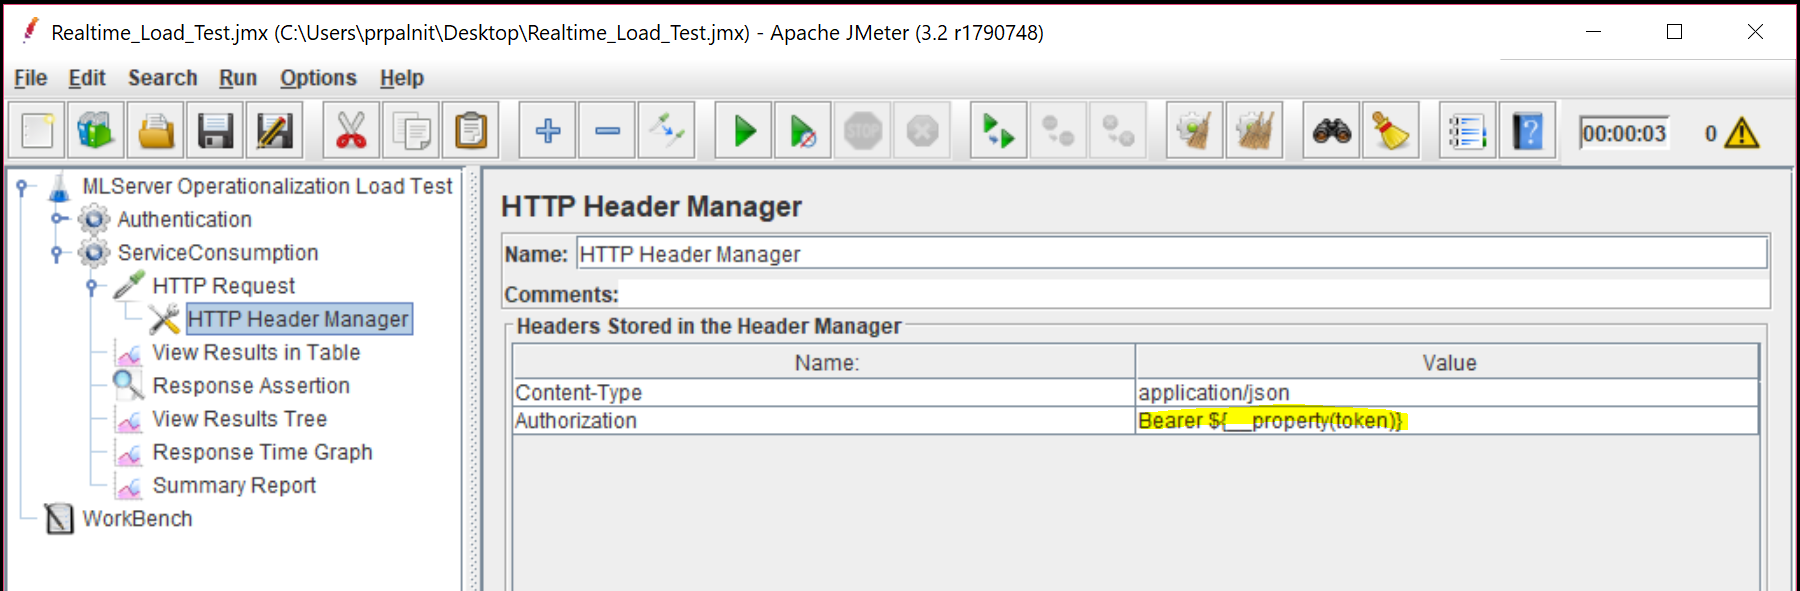
Let's add a "HTTP Header Manager" under the HTTP Request sampler. We will add 'Content-Type' and 'Authorization' header values as shown. Notice, we are using "Bearer <token>" format for the Authorization header value and the token in our case is the property we set in first thread group.
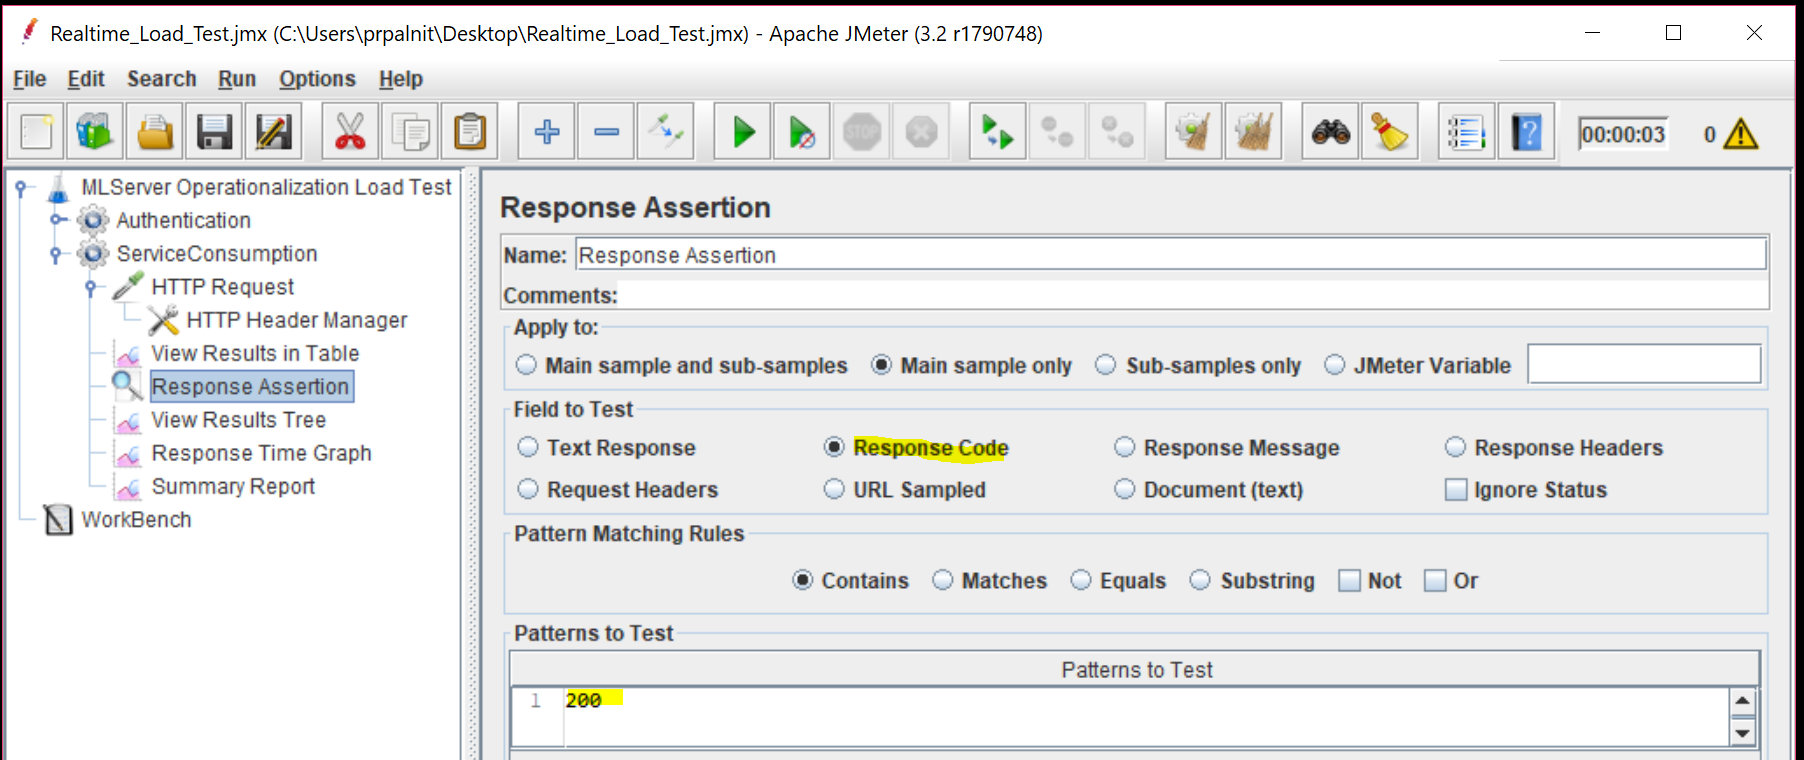
A request assertion will help JMeter to identify how to assert the server response is successful or not. In our case, we will look for HTTP status response 200 (OK) to assert this.
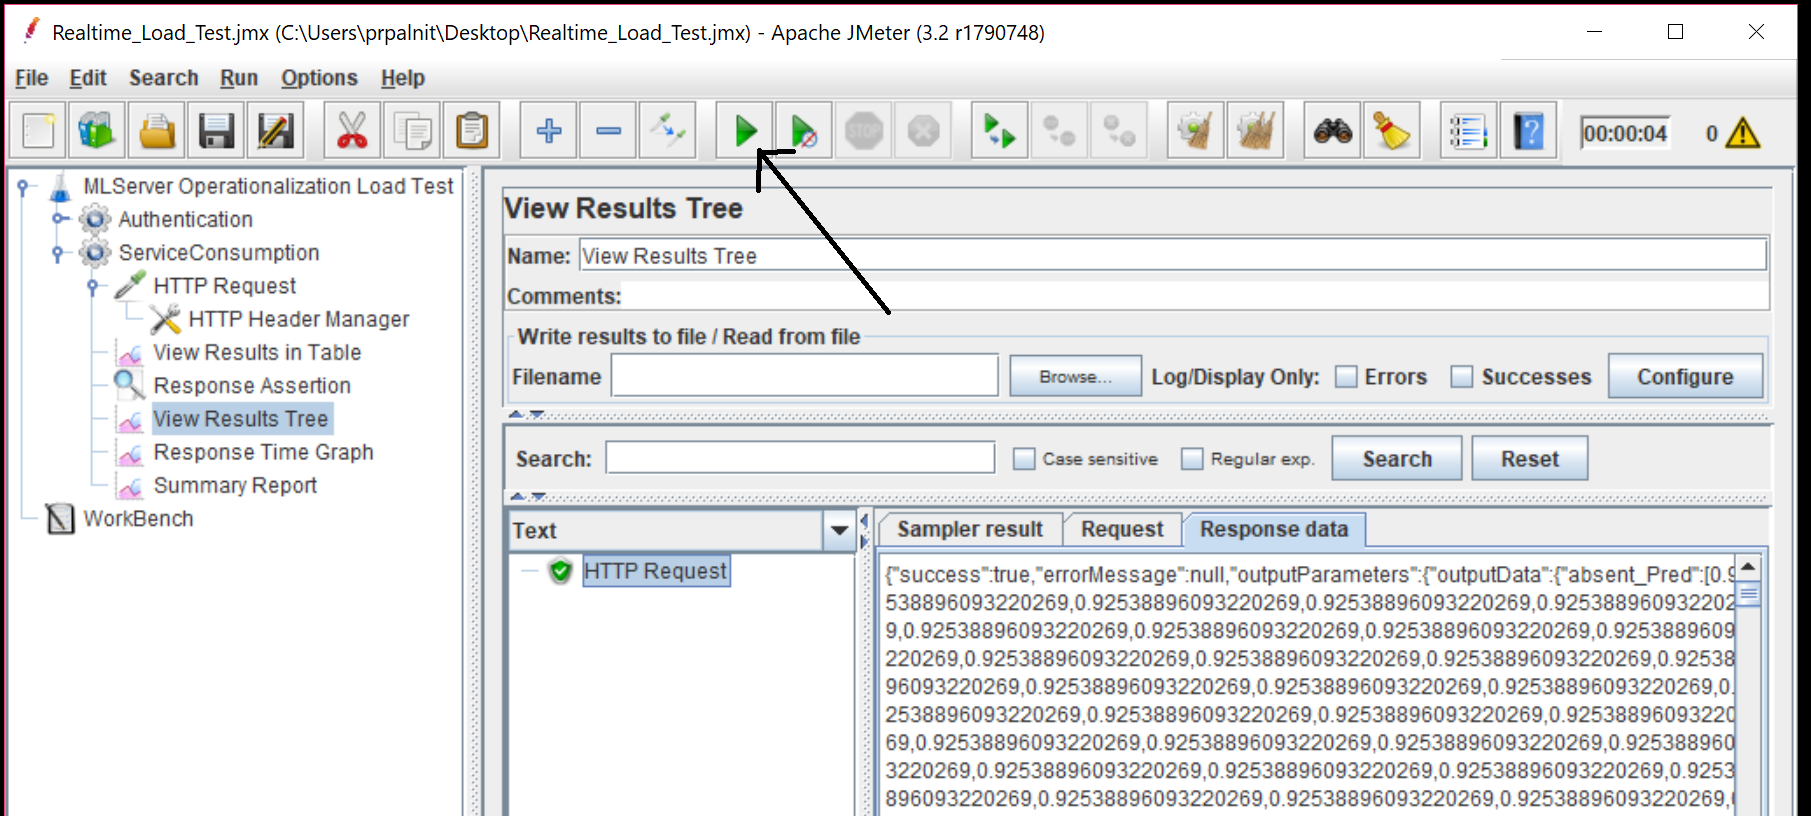
At this stage, we should have everything set up! Let's try it out... Let's add a "View Results tree" listener under ServiceConsumption thread group. Then, click on the run button. For debugging, you might want to temporarily change the number of threads to 1 and disable 'forever' checkbox property in 'serviceConsumption' thread group. Once the run is complete, you should see successful HTTP requests as shown.
Save your test plan as a "Realtime_Load_Test.jmx" file on your machine.
3. Run the Load Test:
Now that we have the test plan ready, we will use JMeter's command line to run the test for us. In previous step, if you debugged the test plan in GUI, remember to change the number of threads back to 1000, and change the 'Loop Count' back to 'forever' and save the file.
Run the command now:
cd [your-jmeter-location]/bin .\jmeter.bat -n -t [your-jmx-directory]/Realtime_Load_Test.jmx -l results.csv (On Windows) .\jmeter.sh -n -t [your-jmx-directory]/Realtime_Load_Test.jmx -l results.csv (On Linux)
For my testing, I used an Azure GS5 instance (32-cores, 448 GB RAM) and ran the JMeter test plan on the same machine against localhost, to reduce network latency. This way, we will have the numbers as close to the actual server performance as possible. Here is how my output looked like:
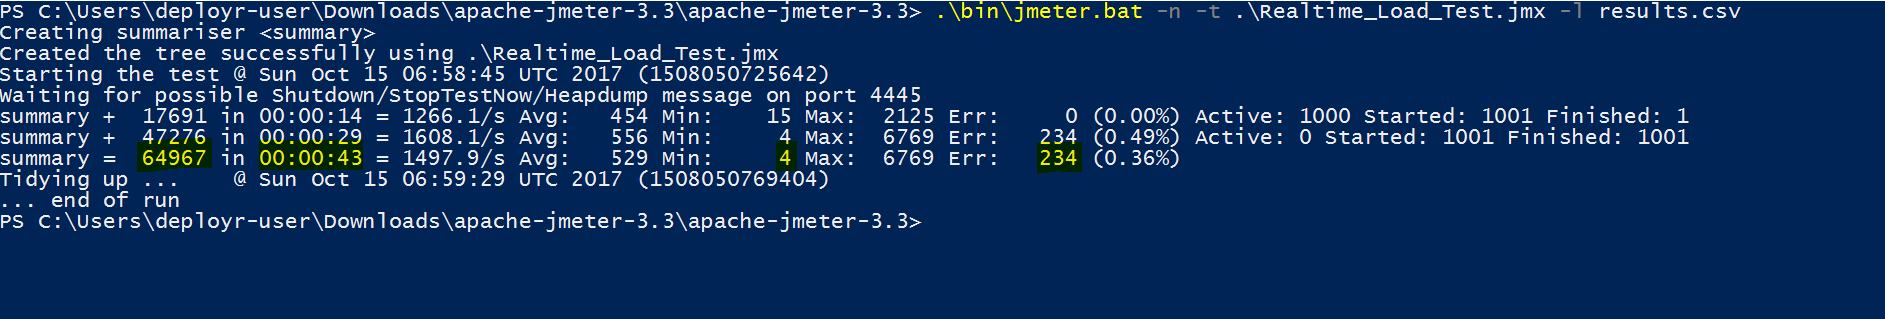
The output shows that within 43 seconds, the server completed around 64,700+ requests @ roughly 1505 HTTP requests per second. Each of our request had 1000 rows of inputs, which means on an average, the server delivered > 1.5 Million predictions per second!
Feel free to play around with the number of threads (users) and the number of input rows with each request (nrows) and see how the server behaves. You will need a good balance of both these numbers for your testing. Too large the number of threads and your threads might end up waiting more for CPU than the server. Too many rows of input requests and your network stack performance will impact your numbers.
I hope this exercise will help you load-test your web-services and prepare you to handle your performance requirements using Machine Learning Server Operationalization.