MDT 2012 New Feature: Monitoring
I was going to do a blog posting talking about how to troubleshoot issues with the new monitoring feature available in MDT 2012 for Lite Touch deployments, but then I realized I’ve not yet done an initial post talking about the feature (although I did mention it in a previous blog posting talking about DaRT integration). So I guess I need to start with more of an overview.
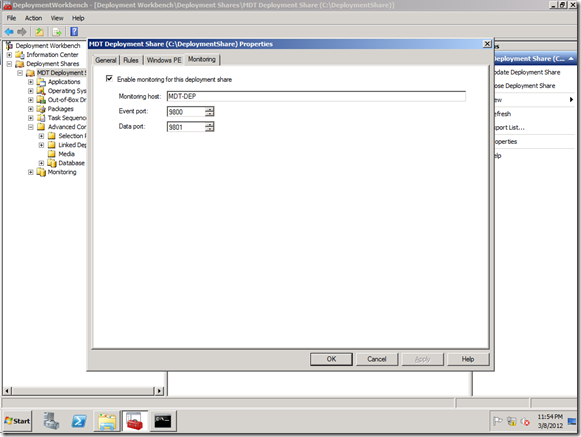
Over the years, there have been requests for a way to see what deployments are presently in progress. Way back when, we had a MOM management pack that tried to do this, but there were numerous challenges with that so we ended up removing it – we needed something much simpler. So with MDT 2012, we implemented something simpler to monitor Lite Touch deployments. To enable this, just check one box in the deployment share properties:
When you do this, two things happen:
- A new service, the “Microsoft Deployment Toolkit Monitor Service” (short name MDT_Monitor), is installed on the computer. This service receives events from the computers being monitored, tracking each computer and how far it is in the deployment process. It also provides this tracking data to Deployment Workbench for you, the administrator, to see.
- The CustomSettings.ini file is modified to add a new entry specifying the URL (a combination of the host name and port specified in the deployment share settings) to be used for monitoring. This is how clients know where to send information. The MDT scripts (through their use of ZTIUtility.vbs) will automatically send events to this URL.
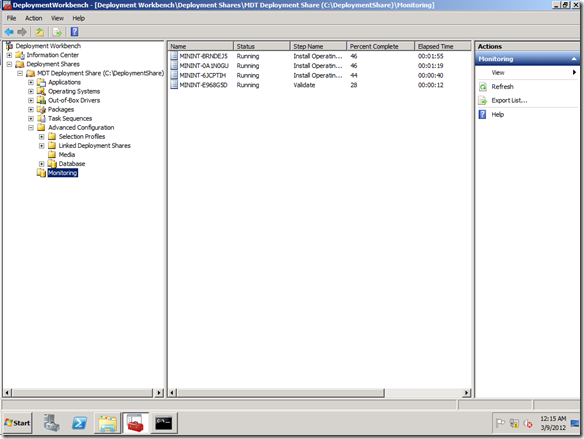
That’s all there is to it. Once you do that, you should be able to track all subsequent deployments via the “Monitoring” node in Deployment Workbench:
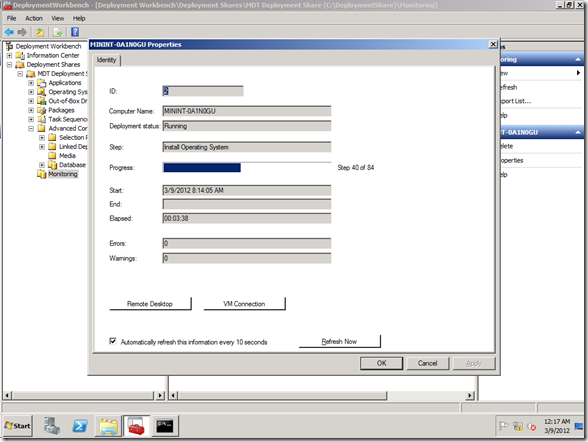
If you look at the properties of any of the computers being monitored, you can see the details:
You’ll notice that the display automatically updates every 10 seconds, so you can watch the computer progress. Also, there are three possible buttons (two of which are shown below):
- Remote Desktop. This button runs the Remote Desktop Client (MSTSC.EXE), specifying the host name to connect to on the command line. (This will only work if the computer is presently in a full OS and remote desktop is enabled and accessible through the firewall. It won’t work if the computer is in Windows PE.)
- VM Connection. This button will only show up if you are using a Hyper-V VM. If you click it, it will run the Hyper-V connection tool (VMConnect.exe) to connect to the host and VM name of the machine. (We gather that information from the Hyper-V integration components from ZTIGather.wsf and pass those values along to the monitor service. Because the integration components don’t run in Windows PE, we can only get this information when in a full OS, so this button will not be enabled when starting a new computer deployment from Windows PE. Also, this requires that the Hyper-V host be accessible from the computer running Deployment Workbench.)
- DaRT Remote Control. This button will only show up if DaRT has been integrated into the MDT Lite Touch boot image. It will run the DaRT Remote Control Viewer, passing along the computer’s IP address, DaRT ticket number, and listening port number, using those values to automatically initiate a remote control session. (This will only work when the computer is in Windows PE, because the DaRT remote control agent only runs in Windows PE.) See https://blogs.technet.com/b/mniehaus/archive/2011/11/28/mdt-2012-new-feature-dart-integration.aspx for more information about the DaRT integration.
A few other details:
- The computers will be automatically removed after three days, to keep the database from getting too big.
- If the monitoring service doesn’t hear from a computer for more than four hours, it considers the machine “unresponsive” – so if you see that status in the Workbench list, that’s why.
- Every time a deployment task sequence starts, completes, or fails, an event log message will be written by the service. So if you want to trigger some activity based on these events, you can easily do so.
- You might think that IIS would be required for the MDT_Monitor service, but it’s not. It’s leveraging features of the .NET Framework to run a “mini web server” as part of the service itself.
- You might also think that a SQL database would be required to store the details. Well, there is one, but you don’t need to install SQL Server to use it. MDT uses a SQL Compact database; all the files needed are installed as part of MDT (and only used if monitoring is enabled).
That’s the quick overview.
Comments
Anonymous
January 01, 2003
Since the deployment process runs as the %Computername%Administrator account, that is the account you would want to specify. If you specified another account, it would forcibly log the Administrator account off, which would be bad if the process wasn't done yet.Anonymous
January 01, 2003
I apologize if this is posted in an incorrect location or has already been answered. In my digging in the depths of the internet I can't seem to find an answer. My monitoring is working great. My question is when an image shows complete the time stamps are 5-7 hours off of our local time. The server is syncing with our time sync/ main servers. I am not sure where to look after that. Any suggestions? Its not a big deal just something I thought I would look in too. Cheers,Anonymous
January 01, 2003
All the times are recorded and displayed in GMT :-)Anonymous
January 01, 2003
Well that makes sense then. Thank you. Much appreciated.Anonymous
January 01, 2003
Amazing! Thank you!Anonymous
March 09, 2012
Nice and very useful feature for a lazy deployment, cause you don't have to run around anymore to check the client on d-day ;-) For the german people....check out my blog @ http://www.mdt2012.de/Anonymous
March 09, 2012
Wow, only if there was sone thing like this for those who don't use MDT. Were straight OSD only :-(Anonymous
March 20, 2012
any troubleshooting hints for monitoring not working?Anonymous
April 18, 2012
How could this be integrated into SCCM 2012?Anonymous
April 28, 2012
Jason, check this out: www.deploymentresearch.com/.../MMS-2012-Using-MDT-2012-Remote-Monitoring-with-SCCM-2007-and-SCCM-2012.aspxAnonymous
May 03, 2012
The comment has been removedAnonymous
August 05, 2012
Great feature! Thank you. Is there a way to change the logs from being written with GMT time stamp. It's not really intuitive....unless you're in GMT timezone. Cheers, JJAnonymous
August 21, 2012
When I click Remote Desktop button I am getting prompted for a credentials and when I enter mine it attempts to open but then says that there is another user logged in and will log them off. Is this expected, or am I expected to enter the computernameadministrator each time?Anonymous
November 26, 2012
mdt 2012 can not be intelligent judgments dual hard drives Scene: My pc has two hard drives, a data disk, and a system disk. Failure: mdt can not distinguish between the data disk and system disk, the system will often installed to the data disk. We look forward to a solution.Anonymous
January 24, 2013
@AnsonChen, if all of your workstations are configured that way, I would develop a VBscript to run as part of your MDT Task Sequence. You camn run that before the installation in the Task Sequence to distinguish which drive should be the installation disk. Pass that out as the OSDisk variable and use that in the Install Operating System phase. Additionally, if you know that all of the workstations are configured that way, you can specify that in the Install Operating System phase. If you're creative, you can engineer a solution using these options: Select the Location where you want to apply this operating system: Next Available Formatted partition Specific disk and partition Logical Drive Letter stored in a variable Specific Logical Drive LetterAnonymous
February 02, 2013
Great information - could you point me (and I would guess others) to information on how we would enable RDP and allow those connections through the firewall as part of the Task Sequence? Thanks, DaveAnonymous
March 28, 2013
We use MDT 2012 to deploy images. Ive followed several of your blogs and have successfully intergrated the driver selection option, DART Tools, and Windows Recovery. Love all your work and all your blogs, thank you. Now that the formalities are out of the way. What if I want to completely run an install remotely? I know I can connect during Windows PE with monitoring enabled I have successfully done so. My question is once it finalizes Windows and is moving on to Applications, I would need user intervention to enable RDP through the firewall in order for me to completely run the install remotely. Would I need to take a base image with these options enabled in order to do this without intervention at the machine itself? I basically want to completely run the install remotely. I would only have the end user boot to the USb and I would take over from there. Can this be done? I believe this is similar to what Dave is askin. Thank you, JasonAnonymous
September 18, 2013
One question do you know if there is there a way to get historic data, like for example the details of how much time has taked the WDS to deploye all the month images deployed? Im trying to get information about the time used by the server to deploy the images and the time that the process taked on the pc side. RegardsAnonymous
November 27, 2013
Hi Guys and Michael, Ok, so we got the Monitoring service working for our first deployment share. We can also enable another deployment share to use the same service and thus also monitor the deployments. however, we would like to split the monitoring of the two deployment shares, in other words, only see Deployment Share A's deployments in its monitoring, and B in B's monitoring. Can we utilise the same service (eg, specify more than 2 ports (9800+9801) + (9805+9806)) or should we have te create another service? Also, maybe an easier route, would be to add extra fields (Columns) under the monitoring fileds and/or DB. Fields like "USERNAME" , "Deployment SHARE" etc - this would atleast allow us to differenciate between Deployment Shares, which would suffice. Would greatly appreciate any thoughts! ThanxAnonymous
October 28, 2014
Is there any way to track which Technician kicked of a deployment task?
Our Techs need to put in their own Admin Creds to connect to the deployment share so I am hoping I can track who deployed a specific machine.Anonymous
March 08, 2016
Hi Michael, Thanks for the above wonderful post , I am able to monitor the deployment from server end an the initial stages till 8th stage of 23 but at certain stage on its stuck and at end its showing the Unresponsive stage but my deployment is completed from client end ,Please help !Anonymous
May 26, 2016
MDT Monitor works great. Very useful feature. Is it possible to view extra info that currently is not being displayed? I would love userid and ip address.


